
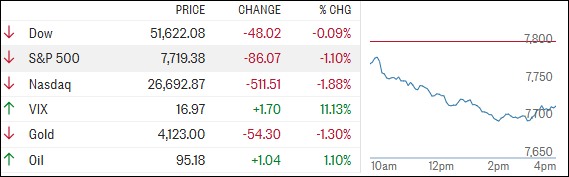
[Chart courtesy of MarketWatch.com]
- Moving the market
Markets came into the day hoping inflation would keep cooling, but September’s CPI report had other ideas.
A slightly hotter-than-expected reading sent bond yields higher, strengthened the dollar, and put immediate pressure on stocks as investors once again questioned how long interest rates may stay elevated.
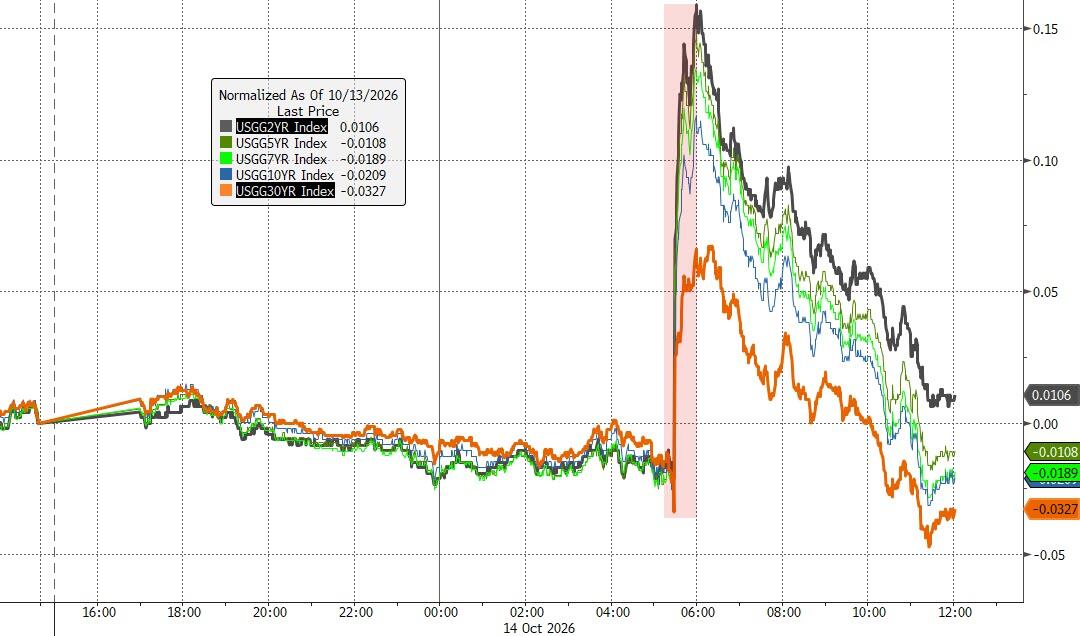
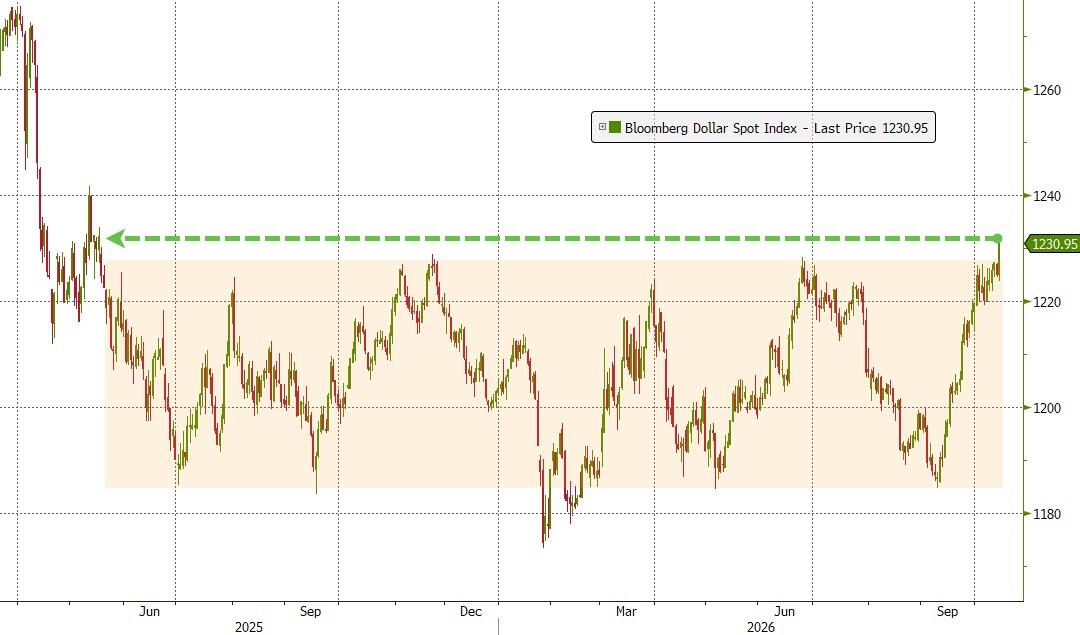
What stood out wasn’t just the inflation data. Several major banks delivered solid earnings, yet their stocks still finished lower, suggesting investors are raising the bar heading into earnings season.
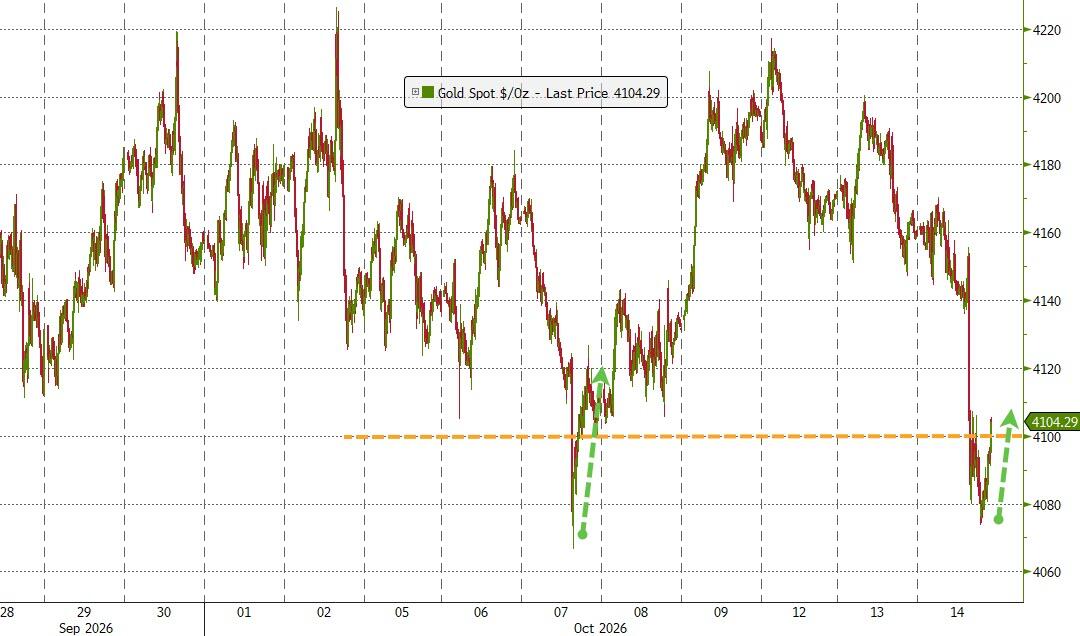
Add in crude oil pushing back above $96, a stronger dollar weighing on gold and crypto, and renewed concerns around AI-related credit risk (CRWV), and you had a recipe for broad-based selling across nearly every asset class.
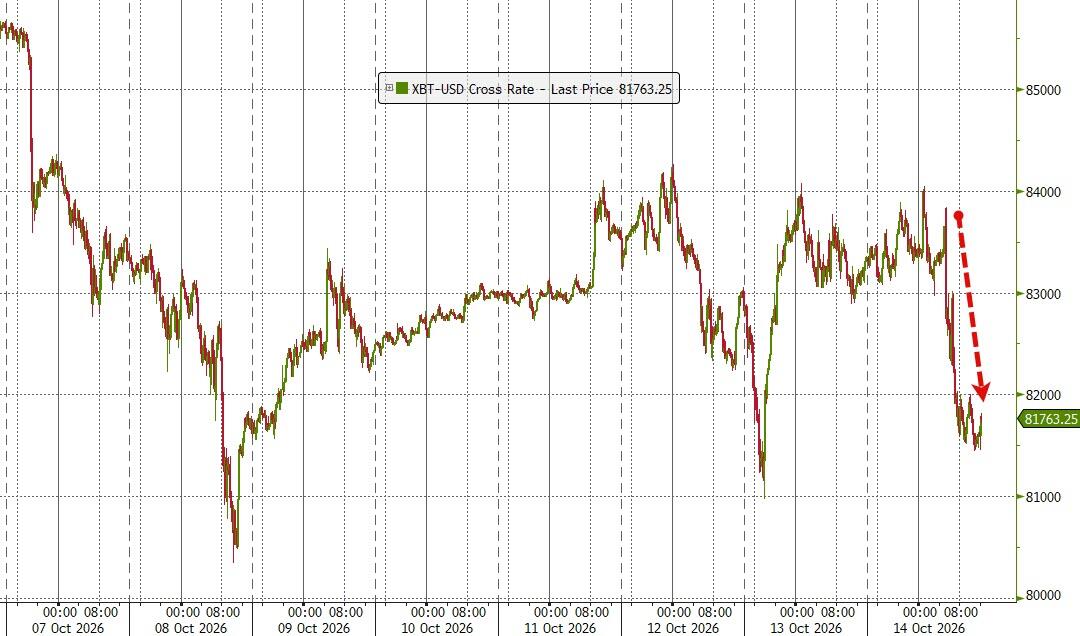
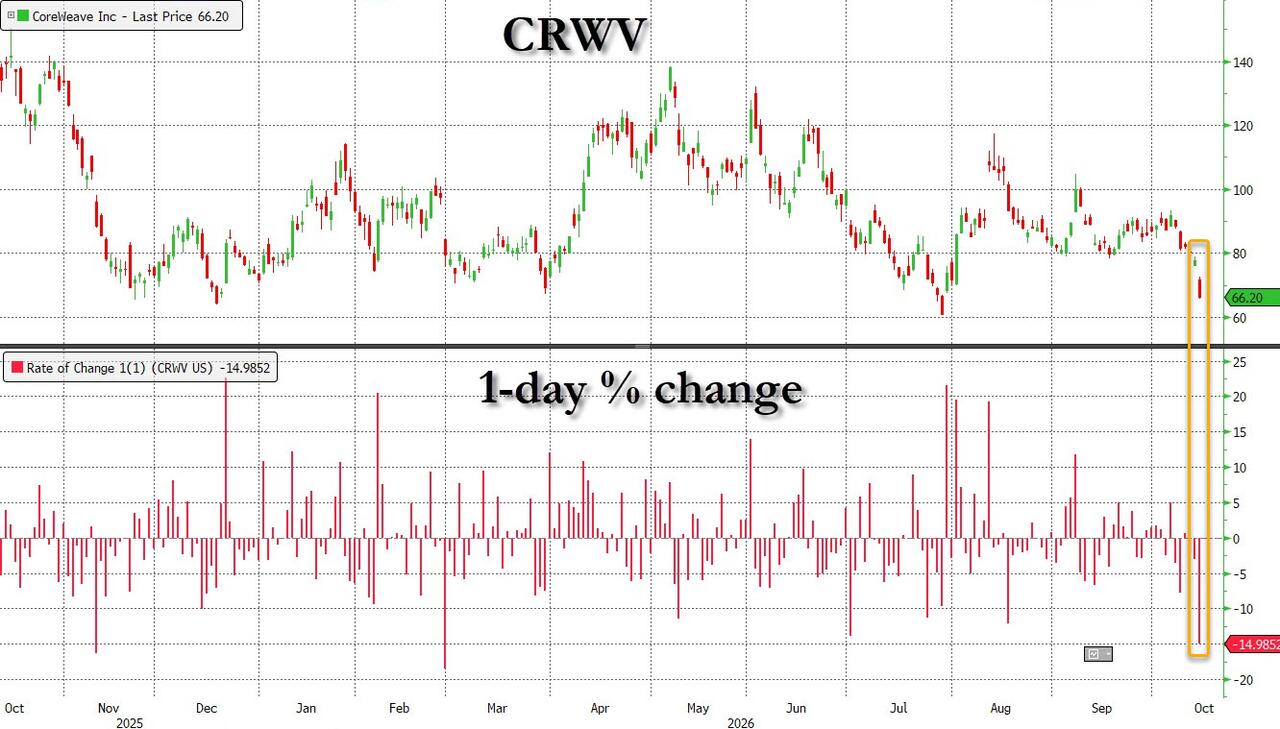
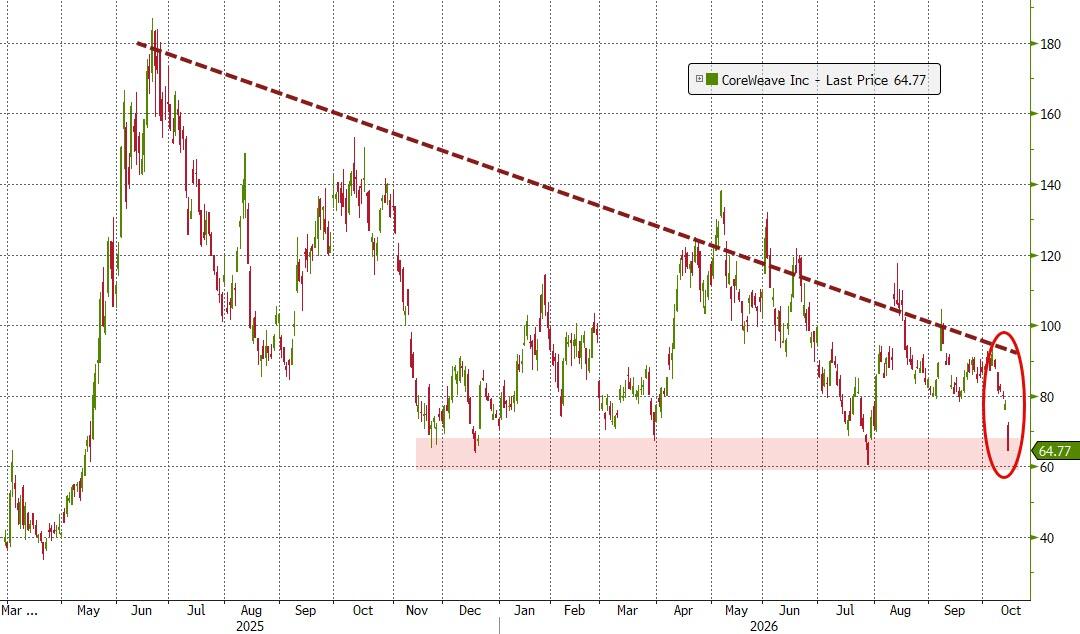
The Magnificent Seven had been carrying the market lately, but even they couldn’t escape gravity today.
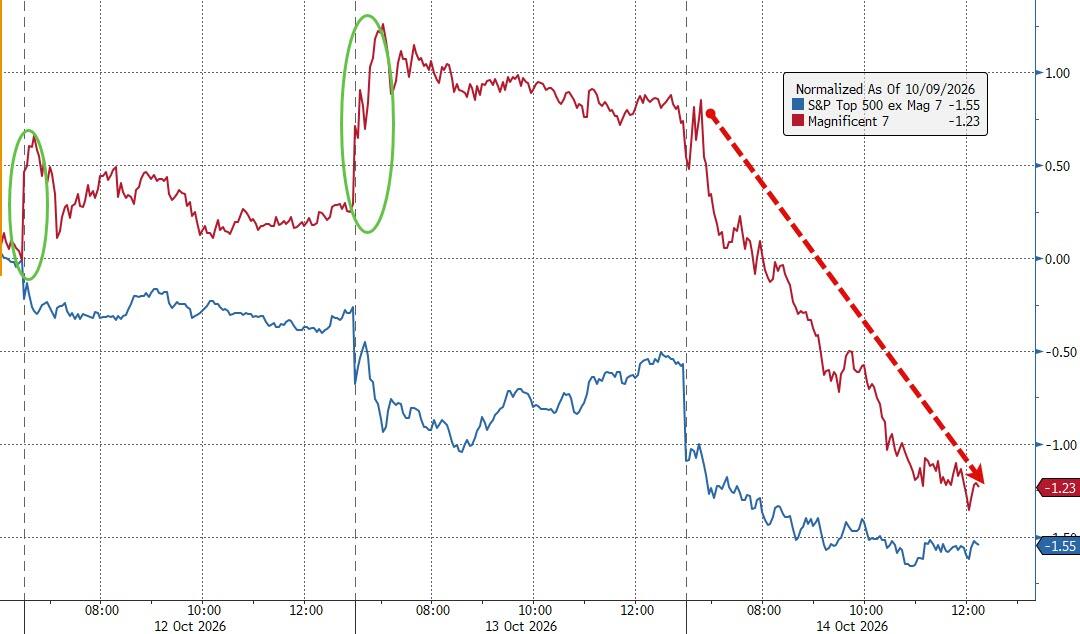
The question now is whether tomorrow’s PPI report can offer some relief, or if inflation and rates will continue to call the tune.
Was today just a bump in the road, or a reminder that the inflation fight may not be over yet?
2. Current domestic “Buy” Cycle (effective 5/20/2025); International “Buy” Cycle (effective 5/8/25)
Our domestic bullish cycle that began on November 21, 2023, concluded on April 3, 2025, following a market downturn triggered by President Trump’s tariff policy announcement.
This development caused significant declines across major indexes and broader market indices. However, markets subsequently rebounded, culminating in a new domestic “Buy” signal taking effect May 20, 2025.
Concurrently, our International Trend Tracking Index (TTI) experienced parallel volatility. On April 4, 2025, it breached critical thresholds, prompting a “Sell” recommendation. This position reversed as global markets recovered, with the International TTI regaining sufficient momentum to issue a new “Buy” signal effective May 8, 2025.
3. Trend Tracking Indexes (TTIs)
Red was the color of the day as a hotter-than-expected CPI report reminded investors that inflation still hasn’t completely gotten the memo.
Stocks took a step back, and even the metals sector couldn’t find much shelter from the selling pressure.
Our TTIs split paths today. The international model showed some welcome resilience, while the domestic model joined the pullback.
Even markets occasionally disagree on the best route, though today neither seemed interested in taking the scenic one.
This is how we closed 10/14/2026:
Domestic TTI: +3.12% above its M/A (prior close +3.70%)—Buy signal effective 5/20/25.
International TTI: +2.94% above its M/A (prior close +2.92%)—Buy signal effective 5/8/25.
All linked charts above are courtesy of Bloomberg via ZeroHedge.
———————————————————-
WOULD YOU LIKE TO HAVE YOUR INVESTMENTS PROFESSIONALLY MANAGED?
Do you have the time to follow our investment plans yourself? If you are a busy professional who would like to have his portfolio managed using our methodology, please contact me directly to get more details.
Contact Ulli