
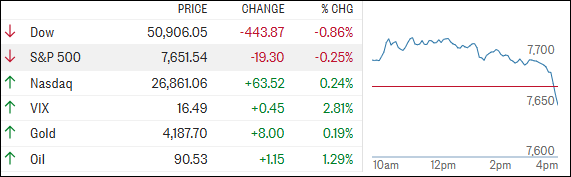
[Chart courtesy of MarketWatch.com]
- Moving the market
Stocks got an early lift as September wrapped up, helped by a friendlier-than-expected inflation report.
Both headline and core PCE cooled, giving traders some hope that the Fed may not need quite as heavy a hand going forward.
But the bond market wasn’t exactly celebrating. The 10-year Treasury yield pushed toward 5.3%, keeping pressure on equities despite falling oil prices.
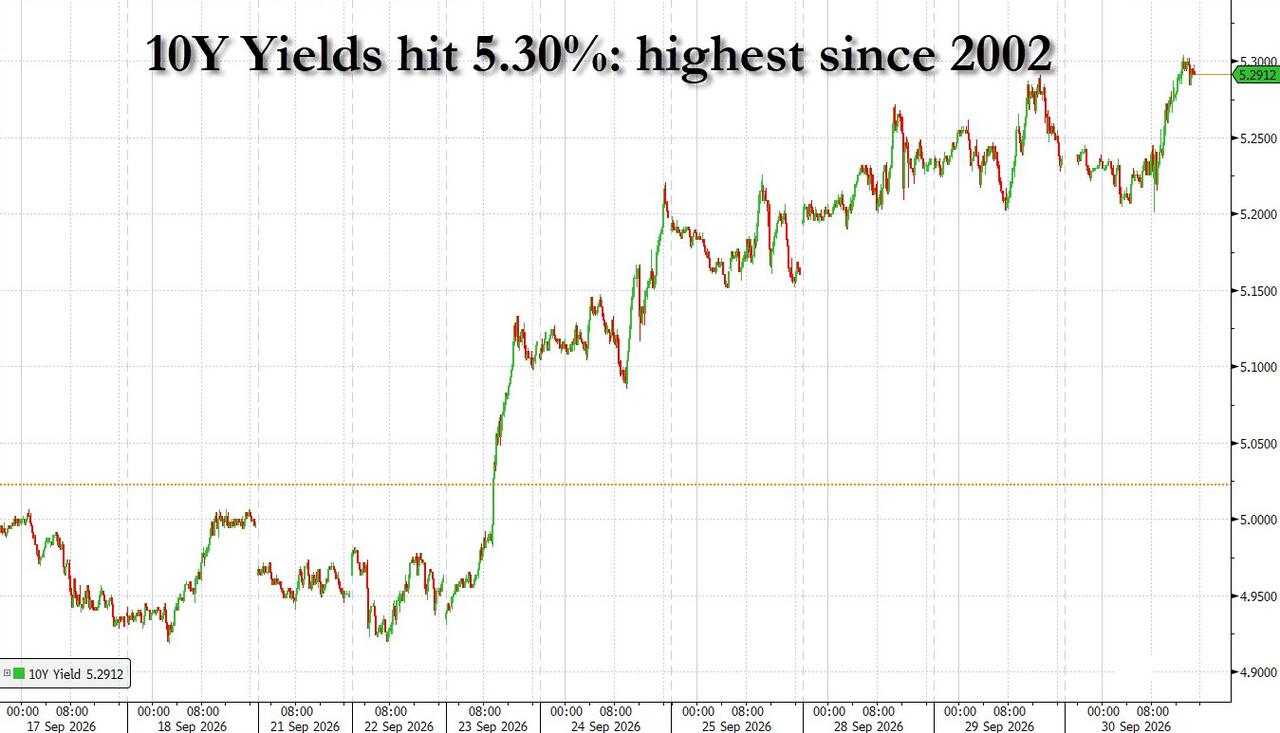
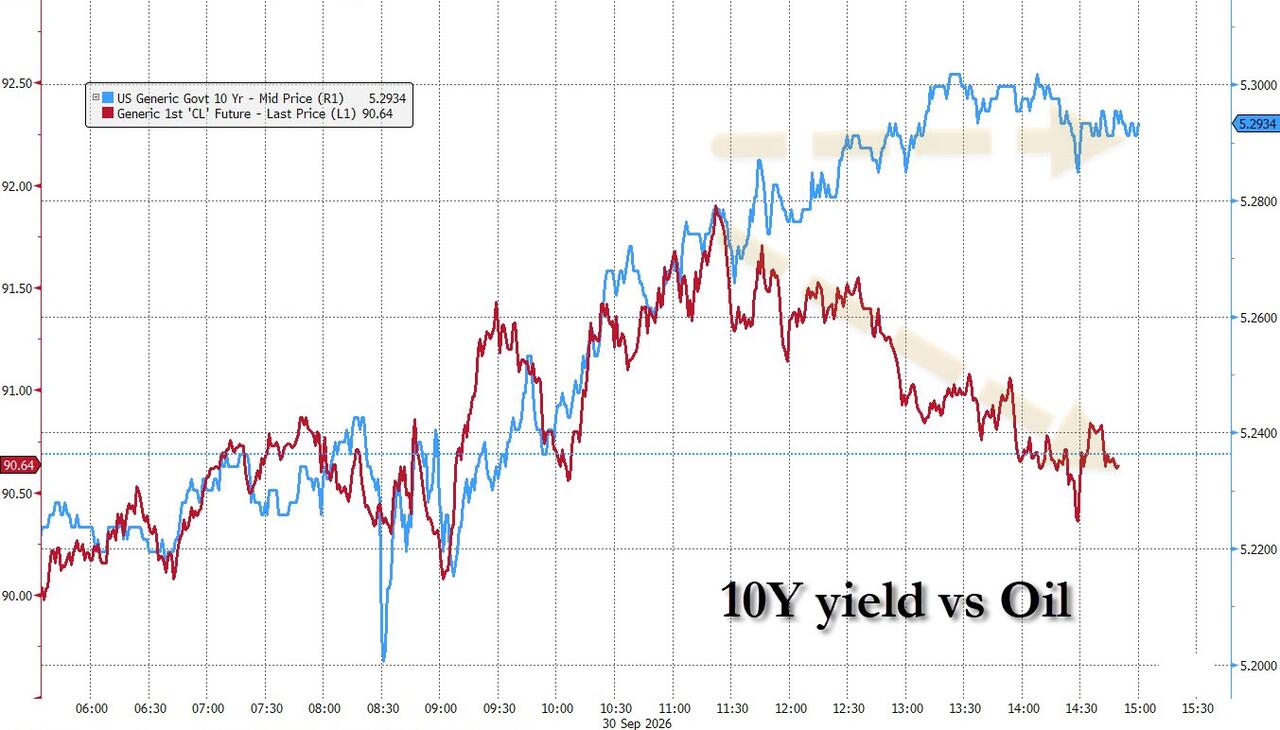
That’s the real issue here: inflation may be improving, but stubbornly high yields remain a formidable headwind for stocks.
Next up is Friday’s jobs report, which could quickly reshuffle expectations for the Fed’s next move.
With October’s reputation for volatility and the midterm elections approaching, the fourth quarter certainly won’t be lacking for potential plot twists. Wall Street does love a little drama.
Will cooler inflation finally tame bond yields, or is the fourth quarter about to give us another roller-coaster ride?
2. Current domestic “Buy” Cycle (effective 5/20/2025); International “Buy” Cycle (effective 5/8/25)
Our domestic bullish cycle that began on November 21, 2023, concluded on April 3, 2025, following a market downturn triggered by President Trump’s tariff policy announcement.
This development caused significant declines across major indexes and broader market indices. However, markets subsequently rebounded, culminating in a new domestic “Buy” signal taking effect May 20, 2025.
Concurrently, our International Trend Tracking Index (TTI) experienced parallel volatility. On April 4, 2025, it breached critical thresholds, prompting a “Sell” recommendation. This position reversed as global markets recovered, with the International TTI regaining sufficient momentum to issue a new “Buy” signal effective May 8, 2025.
3. Trend Tracking Indexes (TTIs)
September went out with more of a whimper than a bang. The Nasdaq managed a modest gain, even as bond yields surged to multi-decade highs.
Metals softened, Bitcoin went nowhere fast, and our TTIs continued to lose altitude.
The good news is that both TTIs remain above their trend lines, keeping us in bullish territory.
The not-so-good news? Momentum is fading, and a potential Sell signal is becoming harder to ignore. For now, we stay the course, but keep the seatbelt fastened.
This is how we closed 09/30/2026:
Domestic TTI: +1.60% above its M/A (prior close +2.32%)—Buy signal effective 5/20/25.
International TTI: +2.58% above its M/A (prior close +2.94%)—Buy signal effective 5/8/25.
All linked charts above are courtesy of Bloomberg via ZeroHedge.
———————————————————-
WOULD YOU LIKE TO HAVE YOUR INVESTMENTS PROFESSIONALLY MANAGED?
Do you have the time to follow our investment plans yourself? If you are a busy professional who would like to have his portfolio managed using our methodology, please contact me directly to get more details.
Contact Ulli