
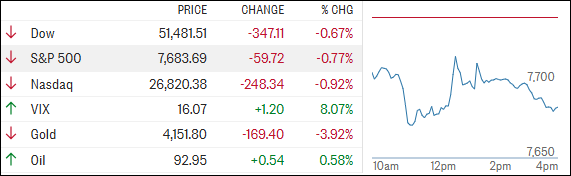
[Chart courtesy of MarketWatch.com]
- Moving the market
Stocks started the week under pressure as higher oil prices and another surge in bond yields gave the bulls a rude Monday-morning wake-up call.
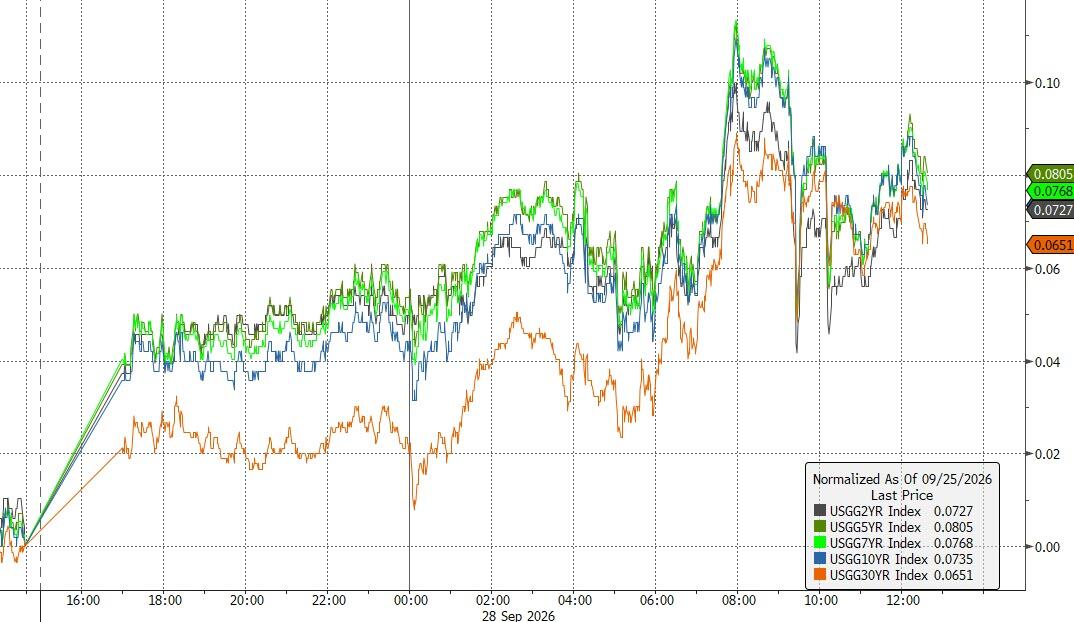
Brent crude jumped more than 2% to around $107 a barrel and WTI moved above $94 after President Trump rejected Iran’s ceasefire conditions. Oil later backed off its intraday highs, but the message was clear: higher-for-longer energy prices aren’t doing the inflation outlook any favors.
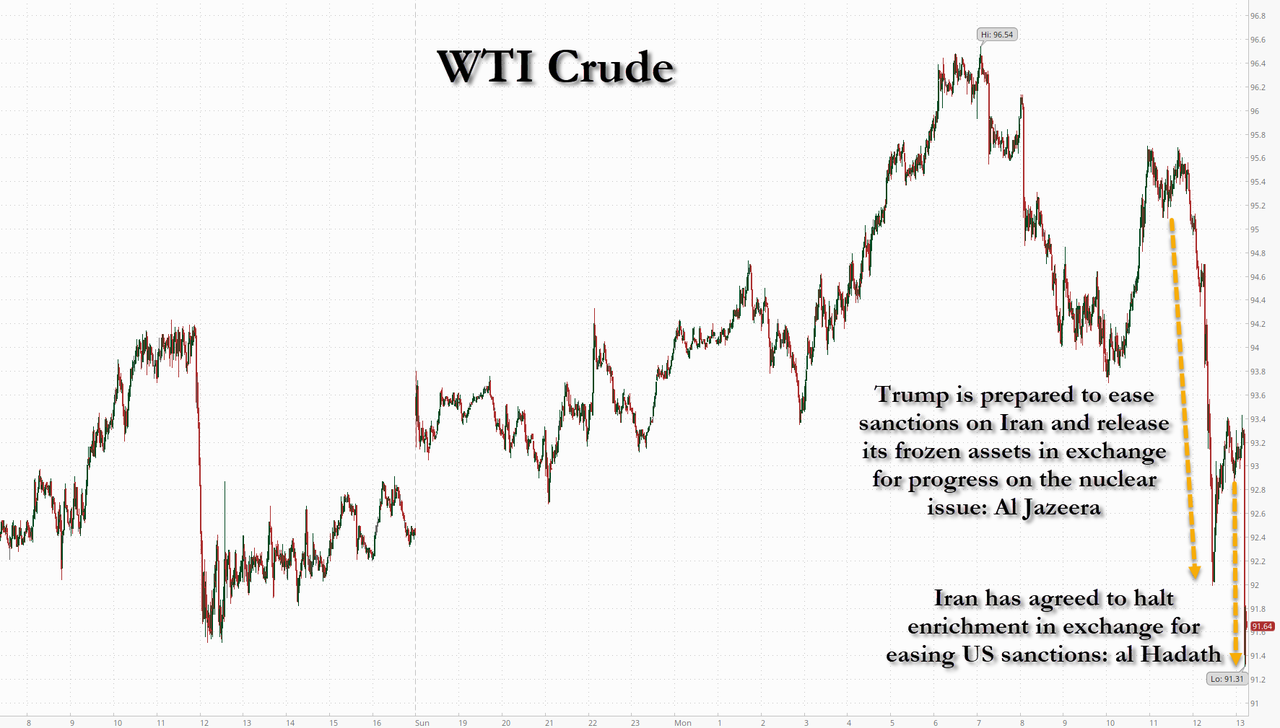
That was reflected in bonds. The 10-year Treasury yield pushed above 5.27%, while the 30-year topped 5.5%, both hovering near multiyear highs. Markets are increasingly recognizing that stubborn inflation, fueled in part by elevated energy prices, could keep central banks pressing the rate-hike button longer than investors would like.
That makes this week’s economic calendar especially important, with PCE inflation on Wednesday, manufacturing data Thursday, and the September jobs report Friday. Plenty of opportunities for the bond market to misbehave.
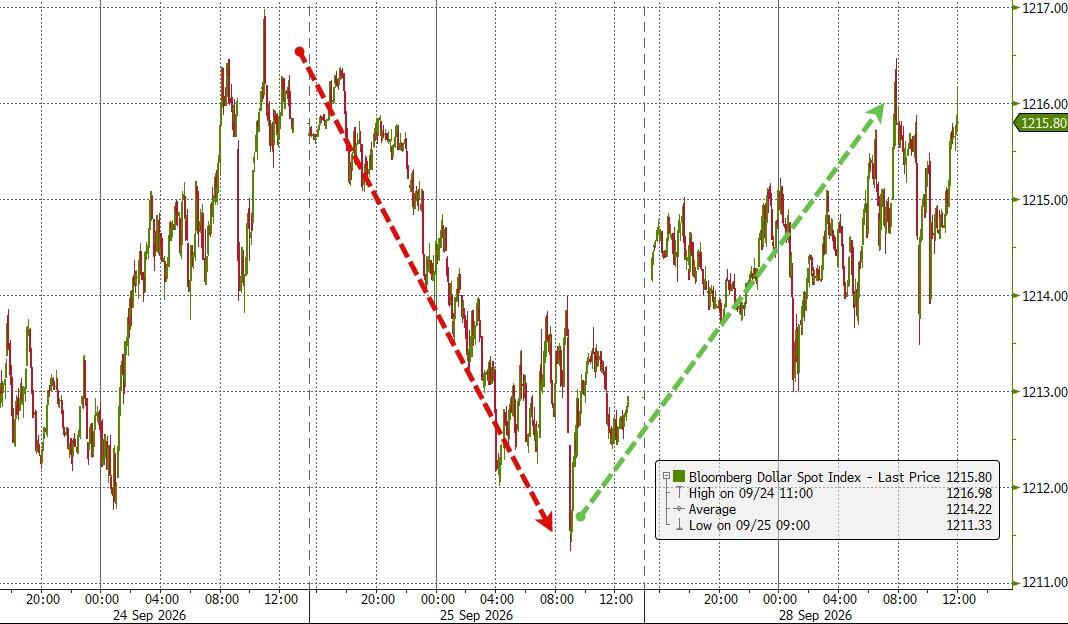
Higher yields nudged the dollar up while gold got clobbered, falling to a nearly two-month low as leveraged traders reportedly liquidated positions to meet margin calls.
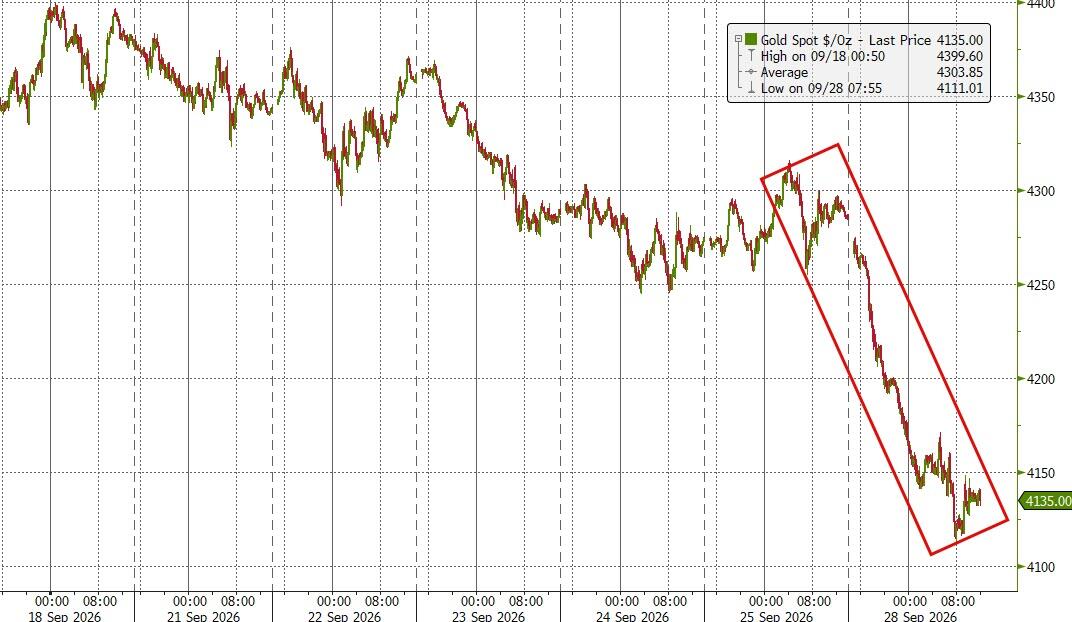
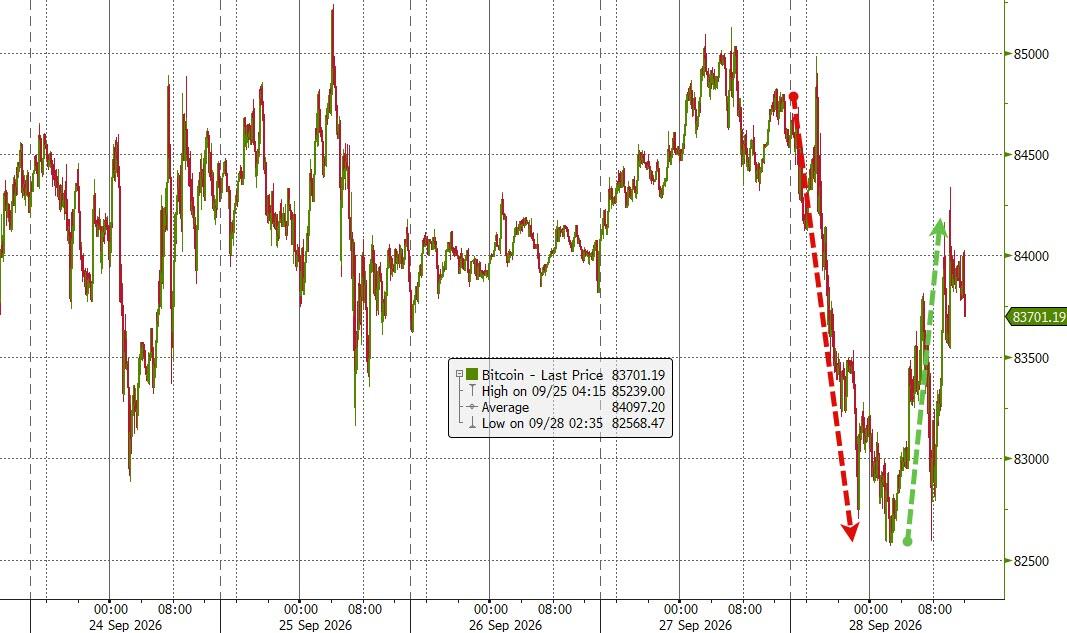
I view that as more of a temporary setback than a fundamental change in gold’s longer-term picture. Bitcoin, meanwhile, performed its usual dump-and-pump routine and finished only modestly below Friday’s close.
The more concerning signal came from market breadth. For the 10th straight session, NYSE new lows outnumbered new highs, while our TTIs continue drifting toward a potential Sell signal.
The major averages may still look reasonably composed, but underneath the surface, the market is clearly losing some footing.
Coincidence, or is the market quietly telling us something before the TTIs (section 3) do?
2. Current domestic “Buy” Cycle (effective 5/20/2025); International “Buy” Cycle (effective 5/8/25)
Our domestic bullish cycle that began on November 21, 2023, concluded on April 3, 2025, following a market downturn triggered by President Trump’s tariff policy announcement.
This development caused significant declines across major indexes and broader market indices. However, markets subsequently rebounded, culminating in a new domestic “Buy” signal taking effect May 20, 2025.
Concurrently, our International Trend Tracking Index (TTI) experienced parallel volatility. On April 4, 2025, it breached critical thresholds, prompting a “Sell” recommendation. This position reversed as global markets recovered, with the International TTI regaining sufficient momentum to issue a new “Buy” signal effective May 8, 2025.
3. Trend Tracking Indexes (TTIs)
The major indexes kicked off the final three trading days of September with a dive and never really found their footing, as surging bond yields kept the pressure on.
Metals got dragged along for the ride, and even Bitcoin couldn’t march to the beat of its own drummer.
Our TTIs followed the bearish tone. They’re still holding above their respective trend lines and remain on the bullish side, but much of the upside momentum has faded.
The bulls are still in the game, but they’ve clearly lost a little spring in their step.
This is how we closed 09/28/2026:
Domestic TTI: +2.44% above its M/A (prior close +3.11%)—Buy signal effective 5/20/25.
International TTI: +3.30% above its M/A (prior close +4.02%)—Buy signal effective 5/8/25.
All linked charts above are courtesy of Bloomberg via ZeroHedge.
———————————————————-
WOULD YOU LIKE TO HAVE YOUR INVESTMENTS PROFESSIONALLY MANAGED?
Do you have the time to follow our investment plans yourself? If you are a busy professional who would like to have his portfolio managed using our methodology, please contact me directly to get more details.
Contact Ulli