
ETF Tracker StatSheet
You can view the latest version here.
TECH TAKES A BEATING WHILE GEOPOLITICAL RISKS ADD TO MARKET JITTERS
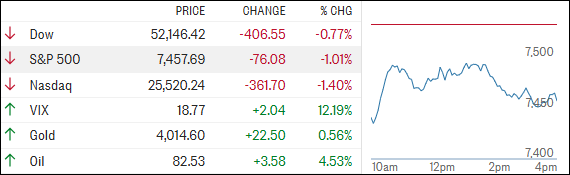
[Chart courtesy of MarketWatch.com]
- Moving the market
Stocks remained under pressure as the S&P 500 extended its decline, putting the index on track for a losing week.
Much of the weakness came from the technology sector, with the Nasdaq taking a particularly hard hit as traders continued to question whether the massive spending spree on artificial intelligence will deliver the returns many have been expecting.
Semiconductor stocks were once again at the center of the selloff. Both the iShares semiconductor ETF (SOXX) and the VanEck semiconductor ETF (SMH) fell more than 2% on the day, with SMH now down roughly 9% for the week.
The weakness added to losses from the previous session, underscoring just how quickly sentiment has turned against one of the market’s strongest groups this year.
A growing concern is the rapid progress of open-source AI models coming out of China.
Reports suggesting these models are beginning to rival offerings from OpenAI and anthropic have investors wondering whether the industry’s enormous ai spending commitments can be justified over the long run.
Outside of semiconductors, Netflix was another notable loser, tumbling more than 8% after its outlook did little to calm fears that subscriber and revenue growth may be starting to slow.
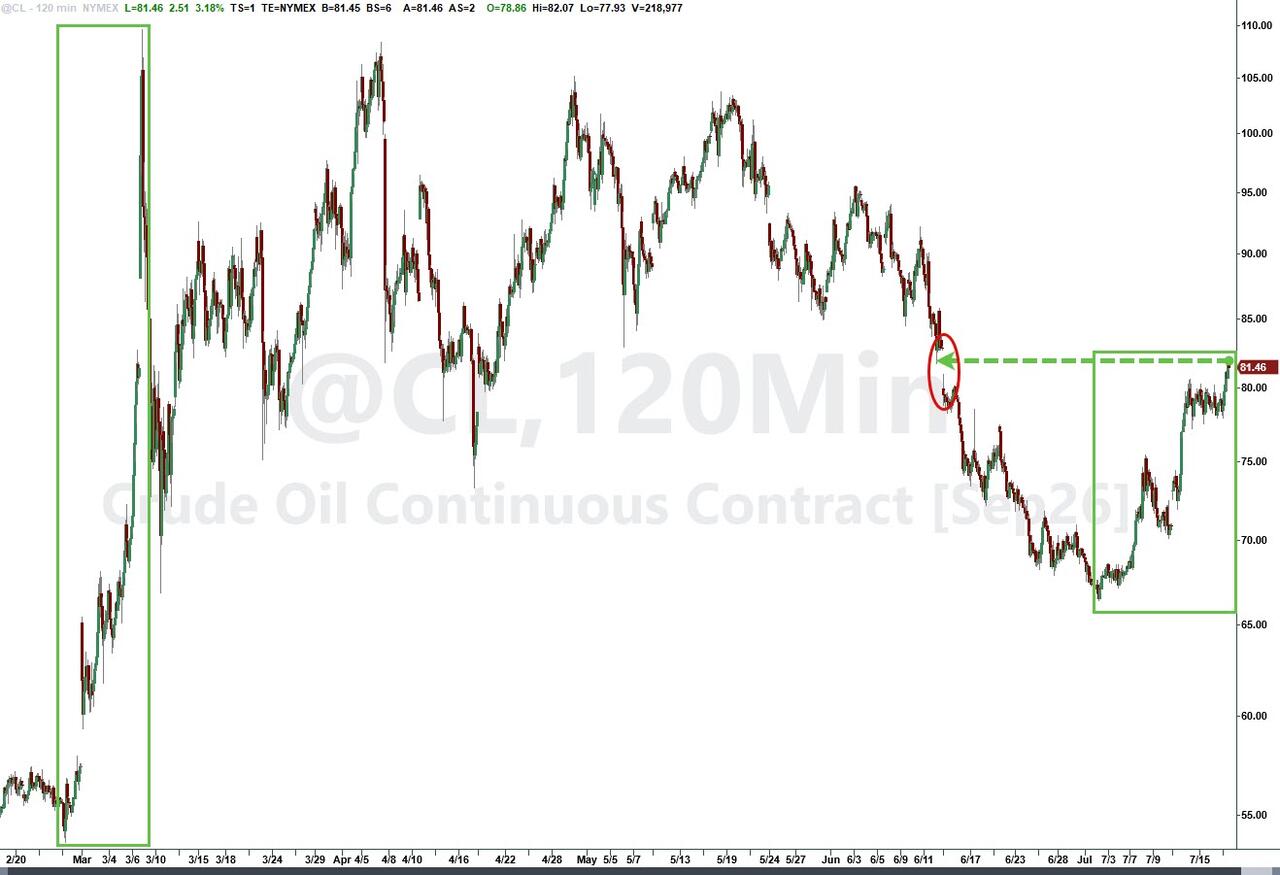
Geopolitical tensions also stayed firmly on investors’ radar. Escalating hostilities between the U.S. and Iran helped push oil prices higher, while reports that Iran targeted U.S. military assets in Syria and Bahrain added to concerns that the conflict could spread further across the region.
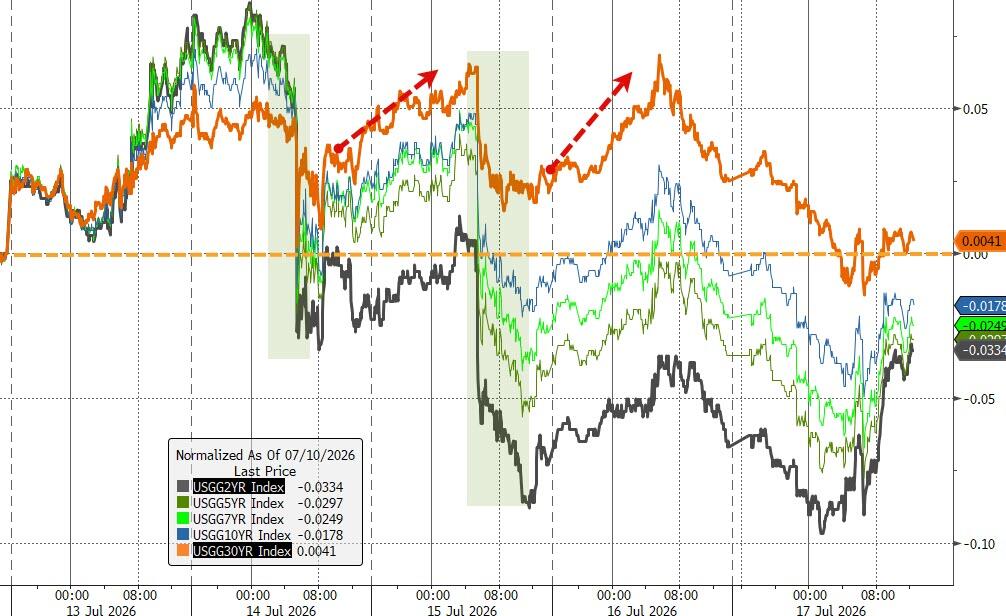
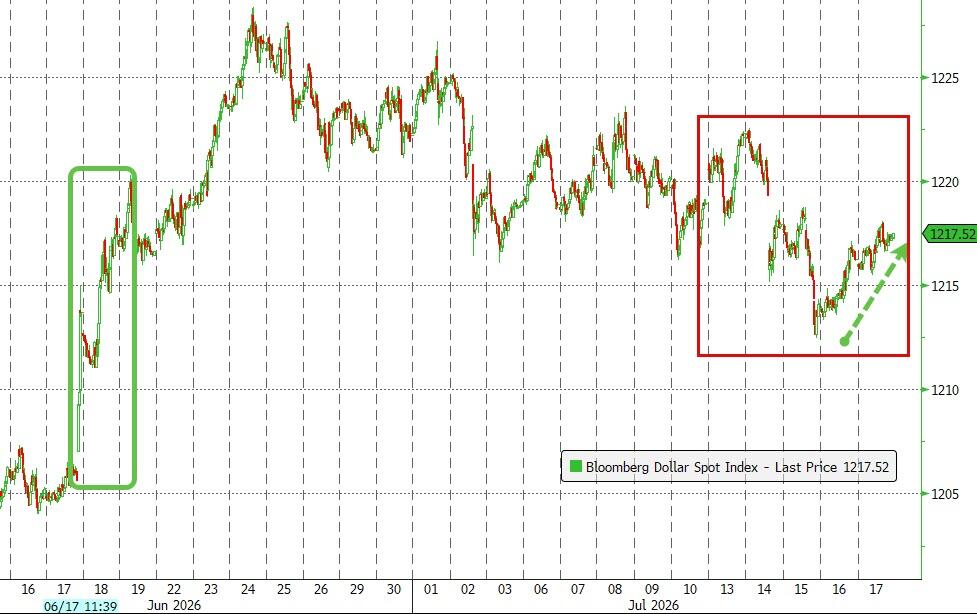
Elsewhere, bond yields moved lower over the course of the week, while the dollar traded choppily.
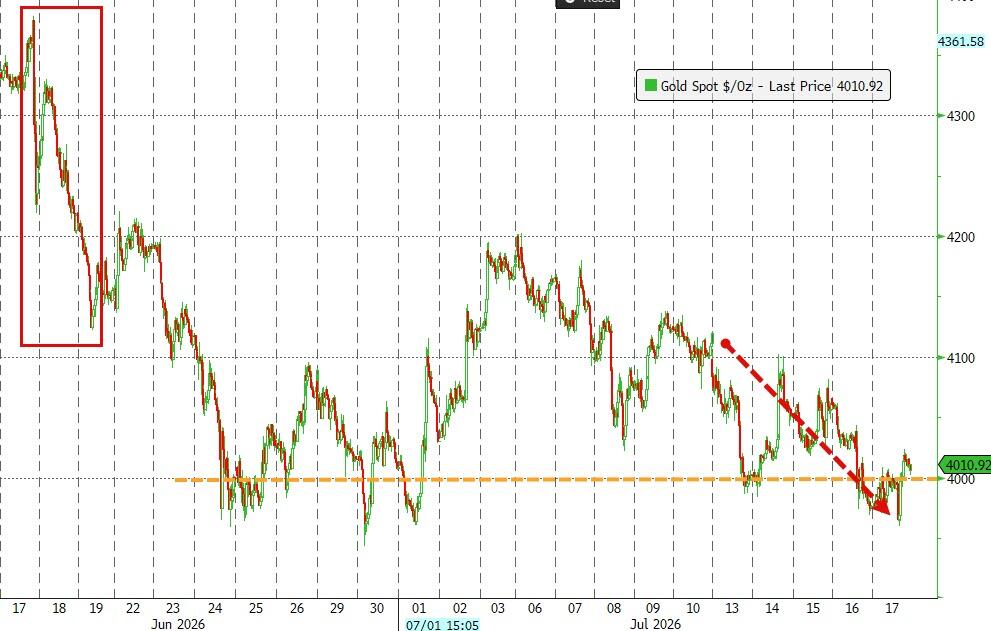
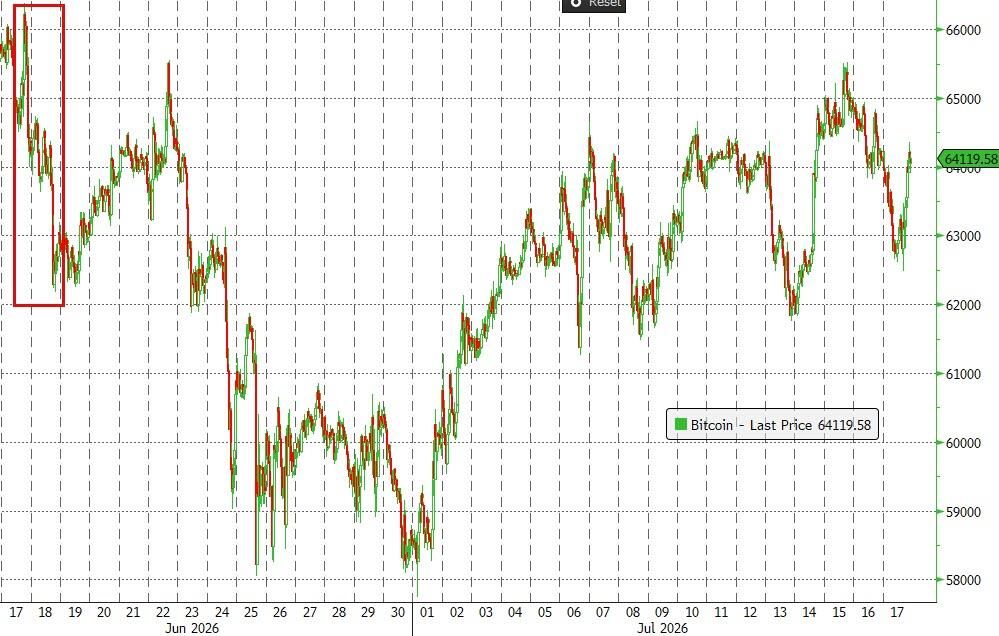
Gold struggled to hold above the $4,000 level, and bitcoin endured another roller-coaster week but managed to finish little changed, showing surprising resilience despite the sharp selloff in technology shares.
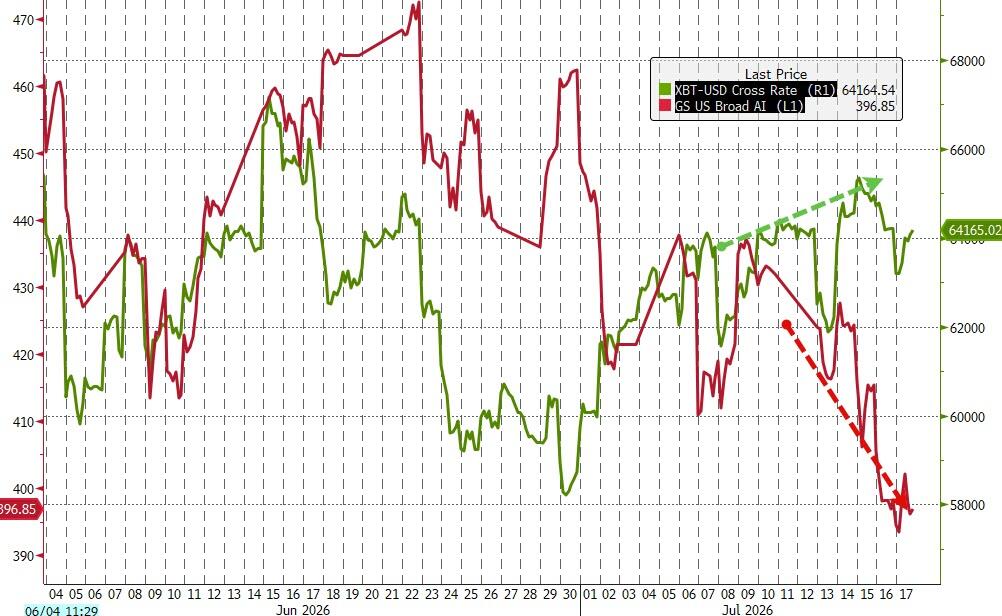
Stepping back, this week’s market action was largely driven by a significant shift in the macro narrative.
Cooler-than-expected inflation data reduced expectations for near-term federal reserve rate hikes, weakening the dollar and prompting traders to rethink many of the trades that had worked so well earlier this year.
As one analyst put it, “everything that has worked year-to-date suddenly seems to be moving in the wrong direction.“
The question now is whether this is simply a healthy rotation beneath the surface, or the beginning of a more meaningful change in market leadership?
2. Current domestic “Buy” Cycle (effective 5/20/2025); International “Buy” Cycle (effective 5/8/25)
Our domestic bullish cycle that began on November 21, 2023, concluded on April 3, 2025, following a market downturn triggered by President Trump’s tariff policy announcement.
This development caused significant declines across major indexes and broader market indices. However, markets subsequently rebounded, culminating in a new domestic “Buy” signal taking effect May 20, 2025.
Concurrently, our International Trend Tracking Index (TTI) experienced parallel volatility. On April 4, 2025, it breached critical thresholds, prompting a “Sell” recommendation. This position reversed as global markets recovered, with the International TTI regaining sufficient momentum to issue a new “Buy” signal effective May 8, 2025.
3. Trend Tracking Indexes (TTIs)
Sellers were in control from the start of the session, sending the major indexes lower and leaving them in the red for both the day and the week.
The tech sector was hit the hardest, accounting for much of the market’s weakness.
While gold and silver bucked the trend and closed higher, our TTIs weren’t immune to the broader risk-off mood and ended the day with modest declines.
This is how we closed 07/17/2026:
Domestic TTI: +7.73% above its M/A (prior close +8.99%)—Buy signal effective 5/20/25.
International TTI: +5.67% above its M/A (prior close +6.69%)—Buy signal effective 5/8/25.
All linked charts above are courtesy of Bloomberg via ZeroHedge.
———————————————————-
WOULD YOU LIKE TO HAVE YOUR INVESTMENTS PROFESSIONALLY MANAGED?
Do you have the time to follow our investment plans yourself? If you are a busy professional who would like to have his portfolio managed using our methodology, please contact me directly to get more details.
Contact Ulli