
- Moving the market
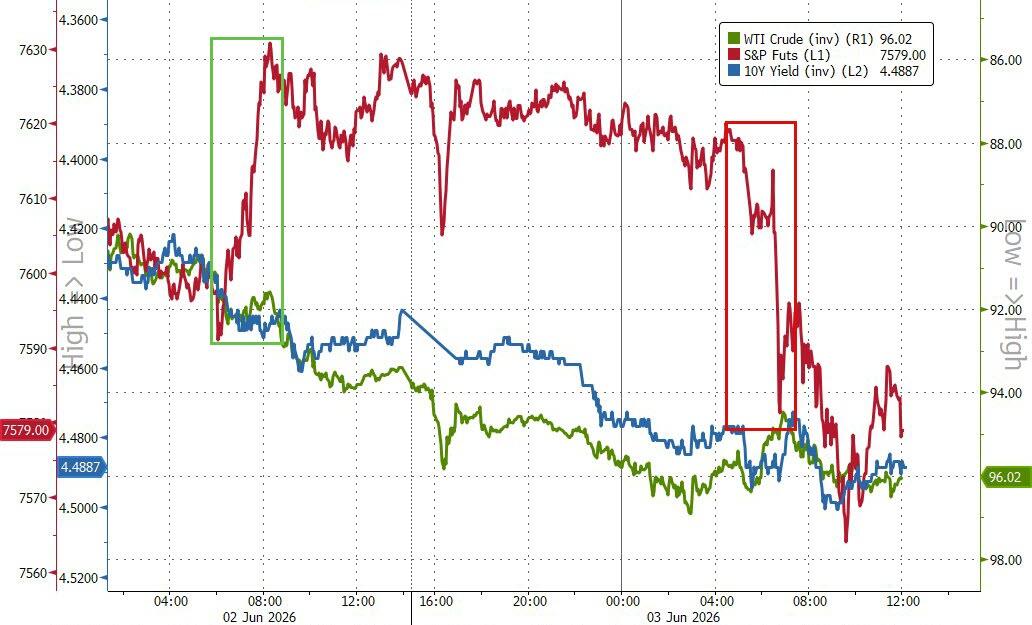
Stocks came under pressure right out of the gate as rising oil prices and climbing Treasury yields rattled investors.
The concern? Ongoing tensions between the U.S. and Iran could keep inflation elevated for longer than expected. Oil moved higher after both countries launched new strikes, with Kuwait reporting overnight that its air defense systems were intercepting “hostile targets.”
Adding to the drag, AI-related names—recent market darlings—took a breather. Nvidia slipped more than 2%, while Dell and Oracle dropped about 5.5%. Microsoft wasn’t spared either, losing around 2%. After such a strong run fueled by optimism and heavy investment in the AI cycle, a pause here isn’t all that surprising.
In fact, the timing makes sense. We’re moving past earnings season, which has been a major tailwind, so a bit of cooling off—or even some added volatility—feels natural as we head into the quieter summer months.
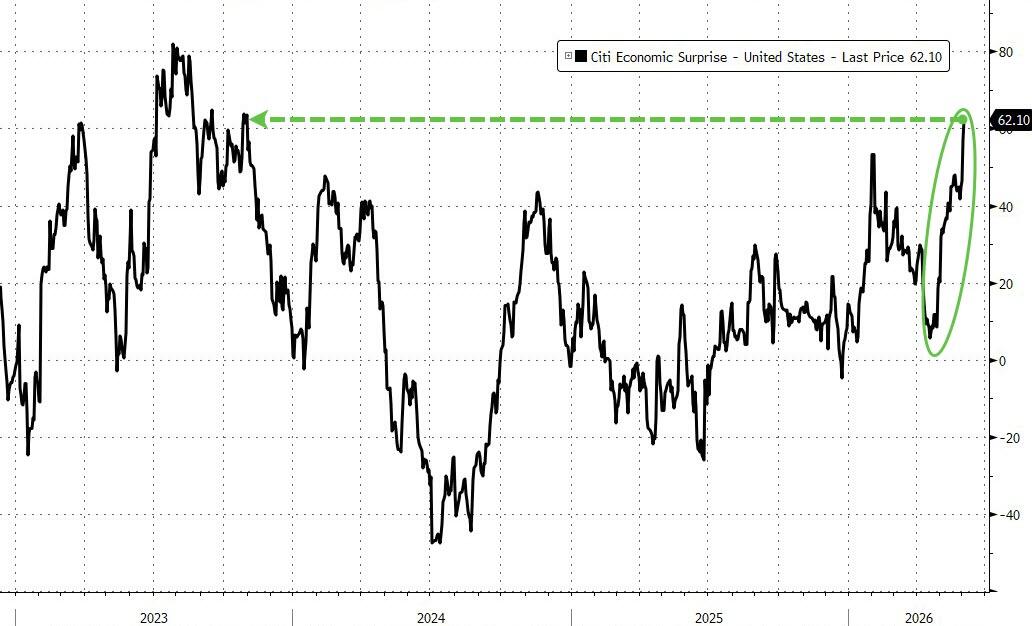
On the economic front, things are a bit mixed. Strong ADP jobs data and solid Services PMI pushed the U.S. Macro Surprise Index to its highest level since September 2023.
Normally that would lift sentiment, but instead it seemed to confuse traders. Yesterday’s bullish momentum quickly gave way to today’s reality of rising oil prices and higher bond yields.
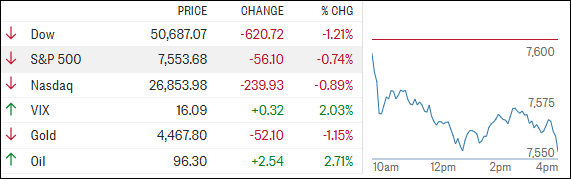
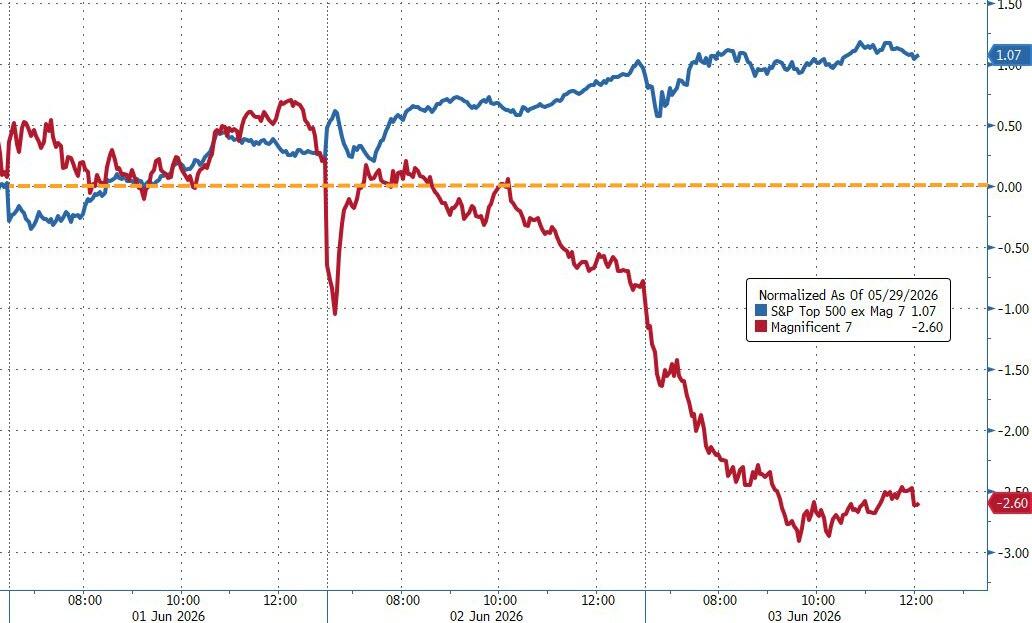
The S&P 500’s 9-day winning streak came to an end, with all major indexes closing lower. Small caps led the decline, while the S&P held up relatively well. The “Mag 7” continues to struggle this week, significantly underperforming the broader S&P 493.
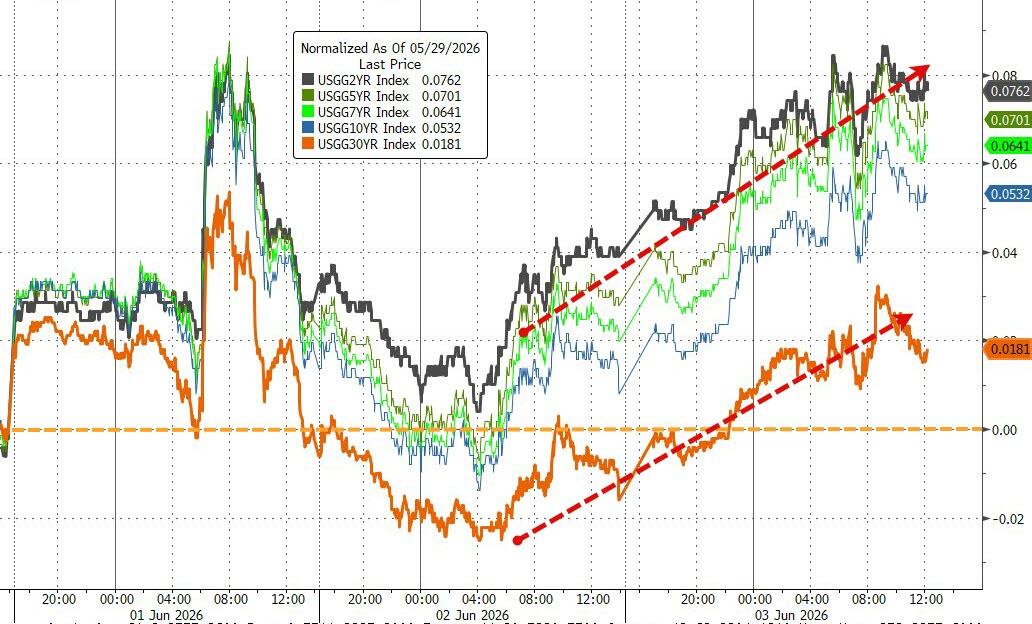
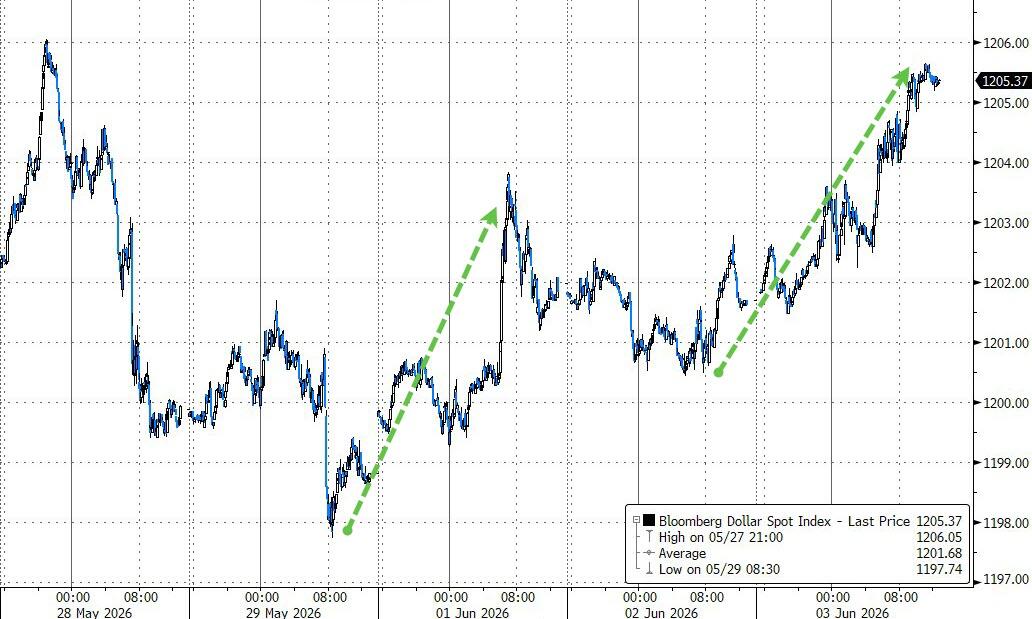
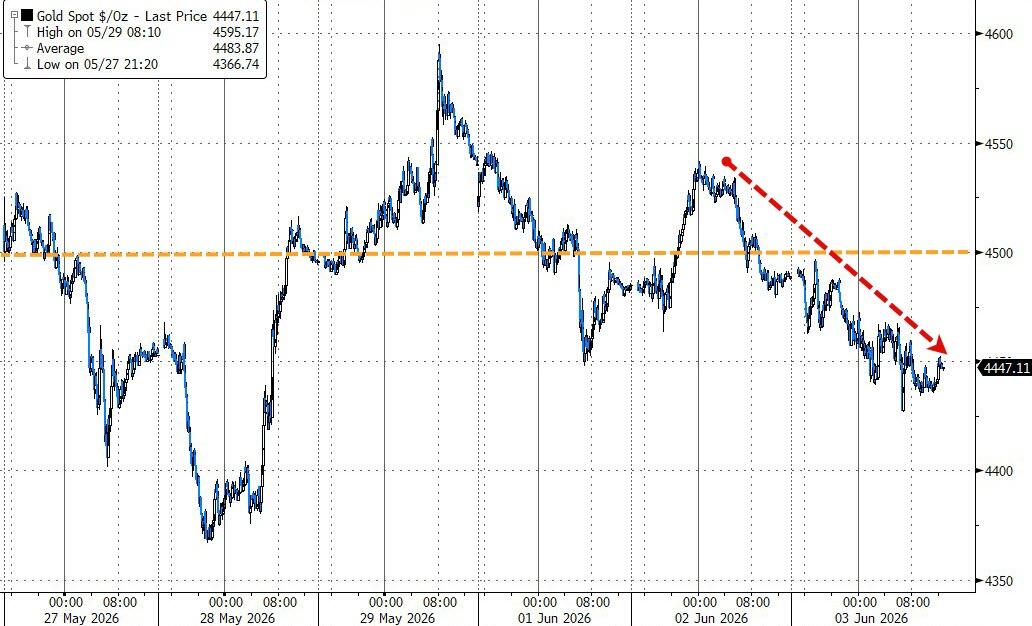
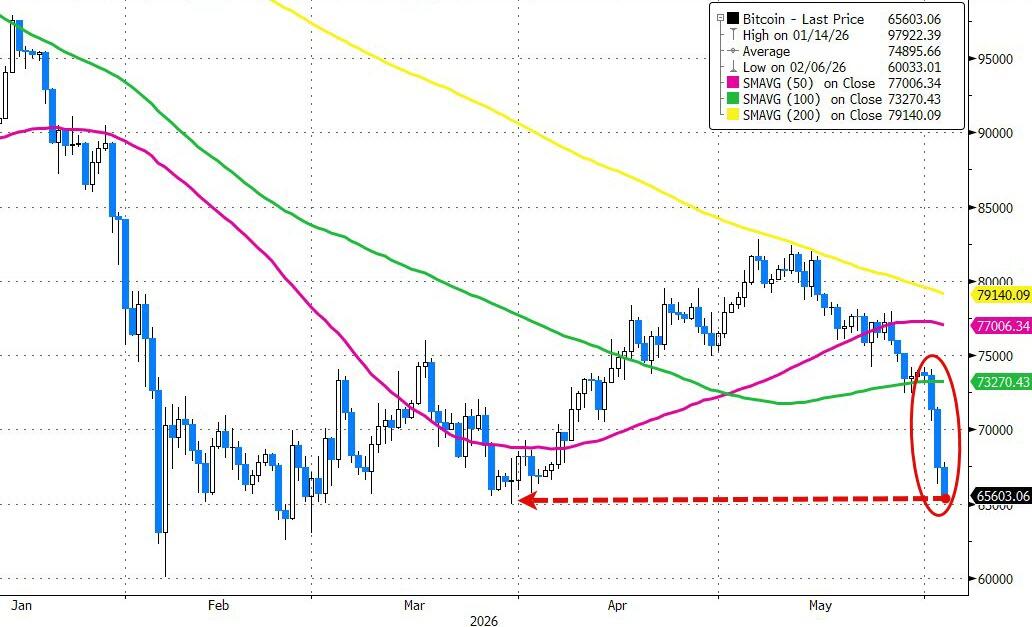
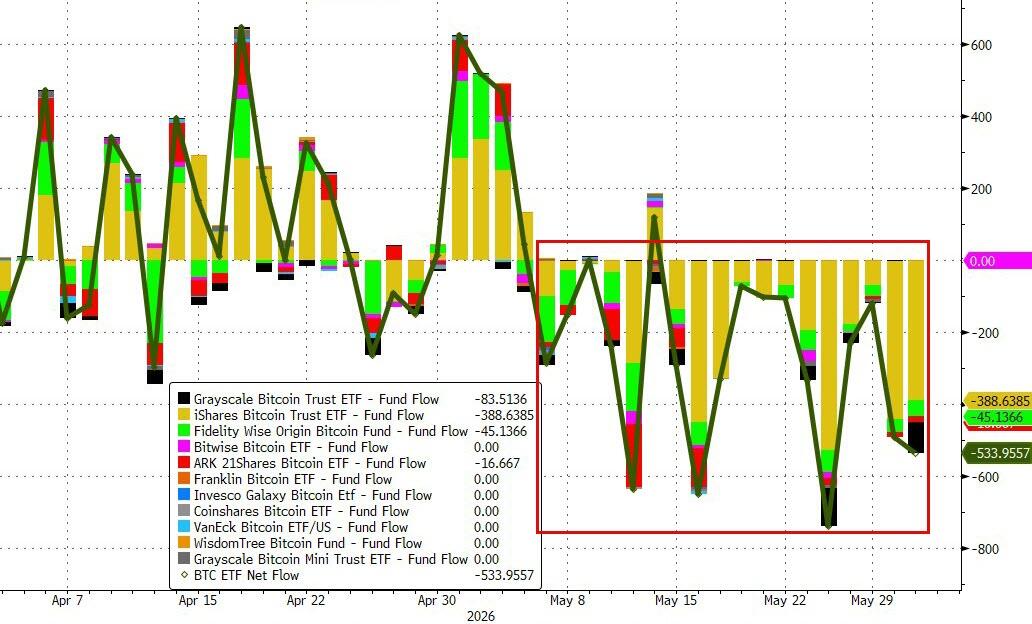
Elsewhere, bond yields spiked, and the dollar strengthened, putting pressure on gold, which slipped again. Bitcoin didn’t offer much refuge either, with sellers pushing it down toward key support levels as ETF outflows continue.
What we’re seeing looks like an extreme positioning shift—money chasing AI stocks while flowing out of gold and crypto, fueling pockets of speculation. The big question is: how long can that imbalance last before something gives?
2. Current domestic “Buy” Cycle (effective 5/20/2025); International “Buy” Cycle (effective 5/8/25)
Our domestic bullish cycle that began on November 21, 2023, concluded on April 3, 2025, following a market downturn triggered by President Trump’s tariff policy announcement.
This development caused significant declines across major indexes and broader market indices. However, markets subsequently rebounded, culminating in a new domestic “Buy” signal taking effect May 20, 2025.
Concurrently, our International Trend Tracking Index (TTI) experienced parallel volatility. On April 4, 2025, it breached critical thresholds, prompting a “Sell” recommendation. This position reversed as global markets recovered, with the International TTI regaining sufficient momentum to issue a new “Buy” signal effective May 8, 2025.
3. Trend Tracking Indexes (TTIs)
Red dominated right from the opening bell, giving the bears an early edge—and they didn’t let it slip away.
Selling pressure stuck around all day, pushing the major indexes lower, with the Dow taking the biggest hit.
The metals followed the broader market’s lead and moved lower as well.
That said, our TTIs held up better than the indexes, which continues to support the current bullish outlook for equities.
This is how we closed 06/03/2026:
Domestic TTI: +7.73% above its M/A (prior close +8.14%)—Buy signal effective 5/20/25.
International TTI: +10.02% above its M/A (prior close +10.47%)—Buy signal effective 5/8/25.
All linked charts above are courtesy of Bloomberg via ZeroHedge.
———————————————————-
WOULD YOU LIKE TO HAVE YOUR INVESTMENTS PROFESSIONALLY MANAGED?
Do you have the time to follow our investment plans yourself? If you are a busy professional who would like to have his portfolio managed using our methodology, please contact me directly to get more details.
Contact Ulli