
[Chart courtesy of MarketWatch.com]
- Moving the market
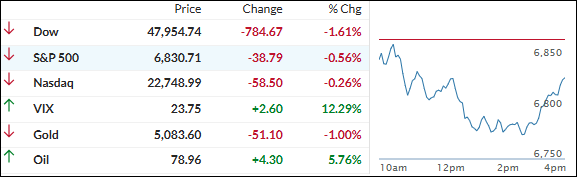
Stocks resumed their slide after yesterday’s brief breather, as fresh worries about the Iran conflict flared up again and sent oil prices surging.
West Texas Intermediate crude futures topped $80 a barrel in the afternoon—the highest since July 2024—after Iran claimed it hit an oil tanker with a missile.
Iranian Foreign Minister Abbas Araghchi added fuel by saying Iran isn’t asking for a ceasefire and sees no reason to negotiate with the U.S. and Israel.
That energy spike triggered big swings all day. The Dow plunged 1,000 points right around the time oil hit $80, dropping as much as 1,100 points (about 2.4%) at its low.
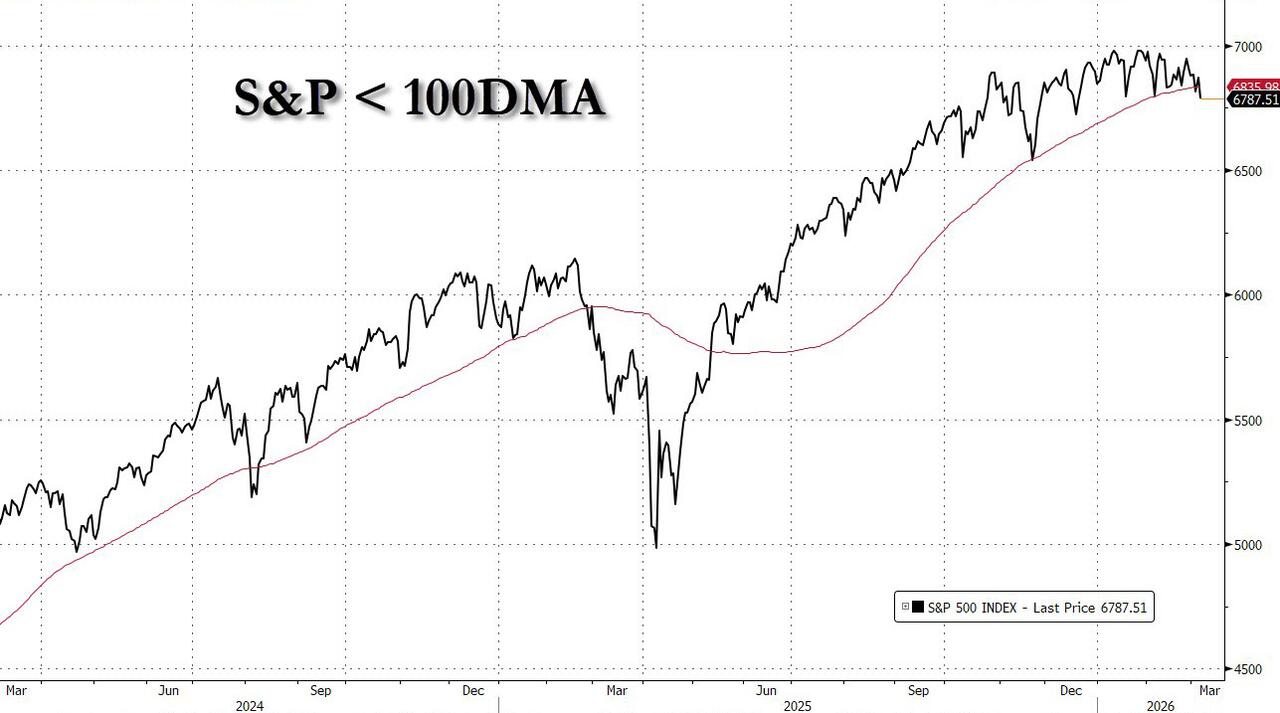
The S&P 500 and Nasdaq also traded near session bottoms after briefly popping above flat early on. The selling pushed the S&P below its critical 100-day moving average (6,836)—a key support level that had held since November’s “Liberation Day” breakout.
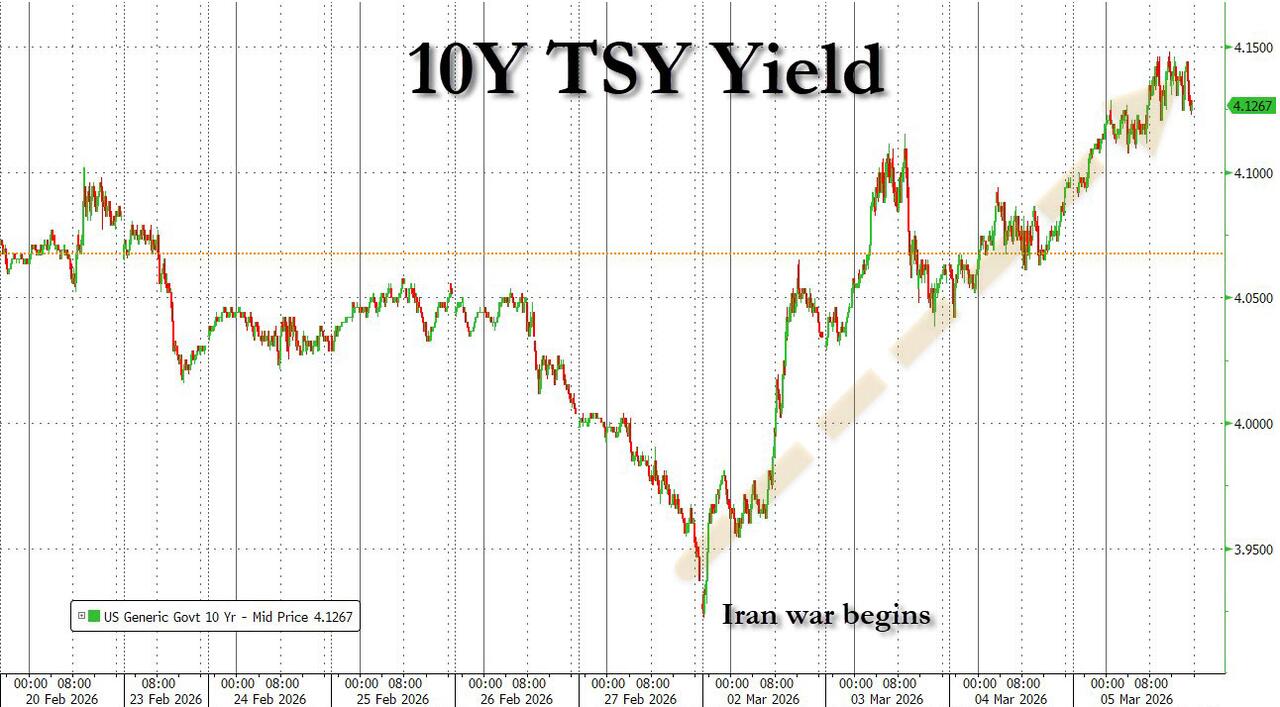
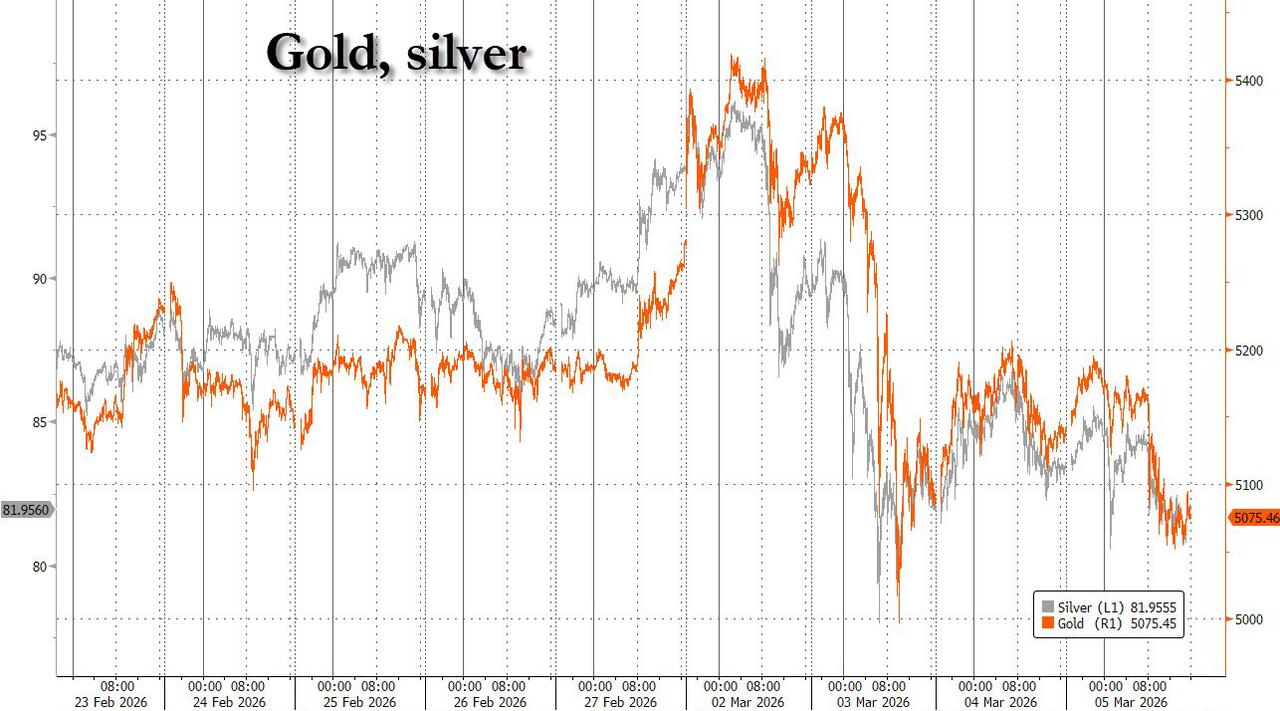
Bond yields rose for the fourth straight session, adding to the pressure, while precious metals and Bitcoin pulled back. Still, most assets bounced off their worst levels late in the day, trimming the damage a bit.
I am pondering if the geopolitical risks might keep the bears in charge a bit longer until tomorrow’s jobs report or some clearer news breaks the stalemate?
2. Current domestic “Buy” Cycle (effective 5/20/2025); International “Buy” Cycle (effective 5/8/25)
Our domestic bullish cycle that began on November 21, 2023, concluded on April 3, 2025, following a market downturn triggered by President Trump’s tariff policy announcement.
This development caused significant declines across major indexes and broader market indices. However, markets subsequently rebounded, culminating in a new domestic “Buy” signal taking effect May 20, 2025.
Concurrently, our International Trend Tracking Index (TTI) experienced parallel volatility. On April 4, 2025, it breached critical thresholds, prompting a “Sell” recommendation. This position reversed as global markets recovered, with the International TTI regaining sufficient momentum to issue a new “Buy” signal effective May 8, 2025.
3. Trend Tracking Indexes (TTIs)
Yesterday’s sea of green flipped right back to a sea of red as global tensions gave the bears full control for most of the session.
The major indexes opened weak and stayed under pressure, but by the close they’d clawed back from their lows and softened the damage a little—still red overall, but not as ugly as it looked mid-day.
Our TTIs bounced along with the broad market recovery but still gave back all of Wednesday’s gains, ending the day lower.
This is how we closed 03/05/2026:
Domestic TTI: +6.09% above its M/A (prior close +7.33%)—Buy signal effective 5/20/25.
International TTI: +7.98% above its M/A (prior close +8.89%)—Buy signal effective 5/8/25.
All linked charts above are courtesy of Bloomberg via ZeroHedge.
———————————————————-
WOULD YOU LIKE TO HAVE YOUR INVESTMENTS PROFESSIONALLY MANAGED?
Do you have the time to follow our investment plans yourself? If you are a busy professional who would like to have his portfolio managed using our methodology, please contact me directly to get more details.
Contact Ulli