
[Chart courtesy of MarketWatch.com]
- Moving the market
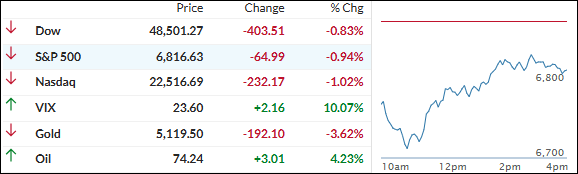
U.S. stocks got slammed right out of the gate, wiping out Monday’s comeback as oil prices spiked again and traders started fretting that the U.S.-Iran conflict could drag on longer than expected.
The Dow was down about 1,200 points (around 2.5%) at one point, while the S&P 500 and Nasdaq each slipped roughly 2.2%.
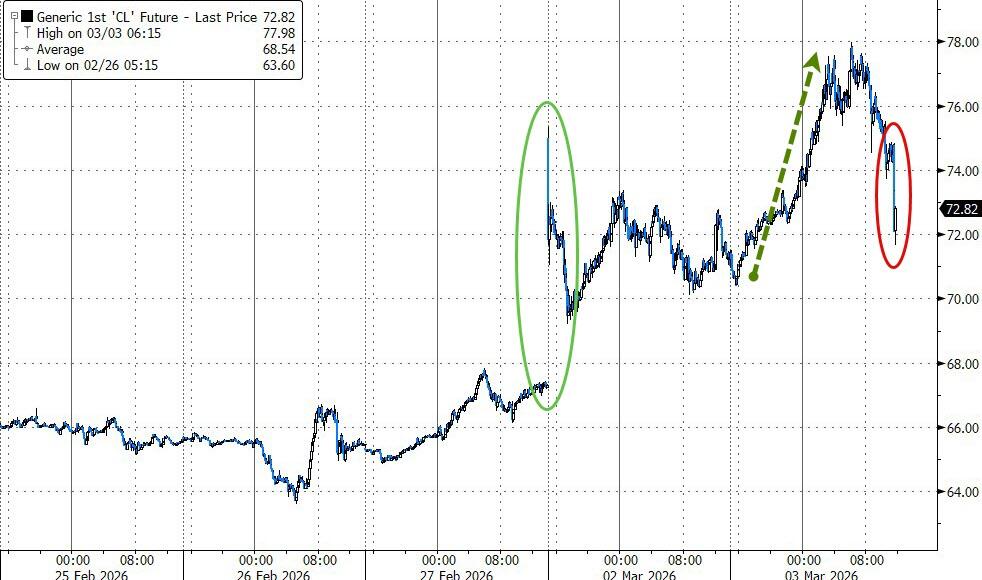
Brent crude topped $84 a barrel (up 8% today after Monday’s 6% jump), fueled by Iran’s Revolutionary Guard commander announcing the Strait of Hormuz—the world’s most critical oil transit route—is now closed, with threats to torch any ships trying to pass.
Other weekend developments added fuel to the fire: U.S. embassy in Riyadh hit by drones, Tehran-backed Hezbollah launching missiles and drones at Tel Aviv, and growing worries about how long Gulf states like the UAE can hold off Iran’s barrage with air defenses.
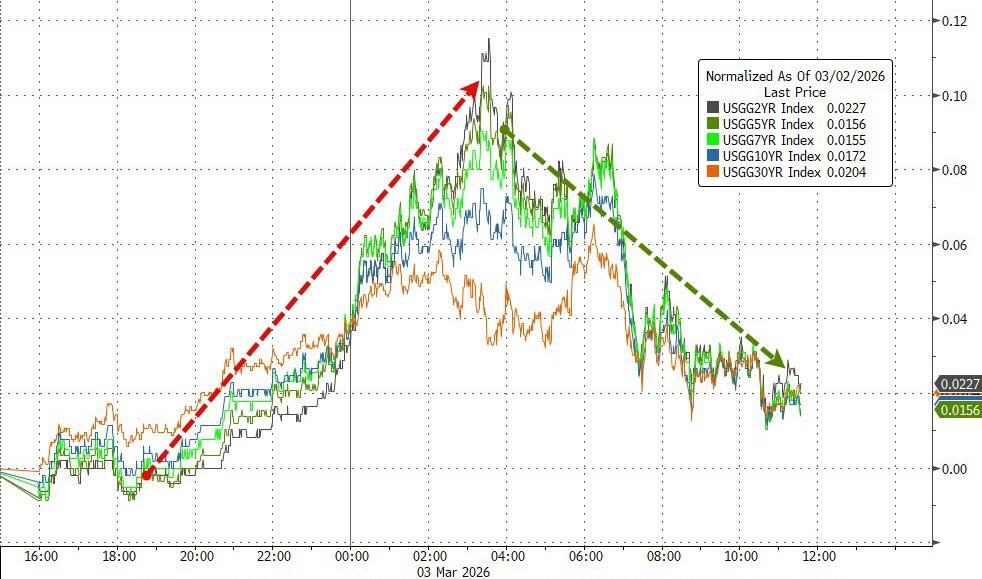
The energy surge pushed Treasury yields higher on fears of inflation flaring back up—just as investors had been counting on more Fed rate cuts.
Tech stocks, which had powered Monday’s intraday bounce, got hit again—Nvidia and Broadcom each down around 2%. There were few places to hide; gold, silver, and crypto all sold off after Monday’s gains.
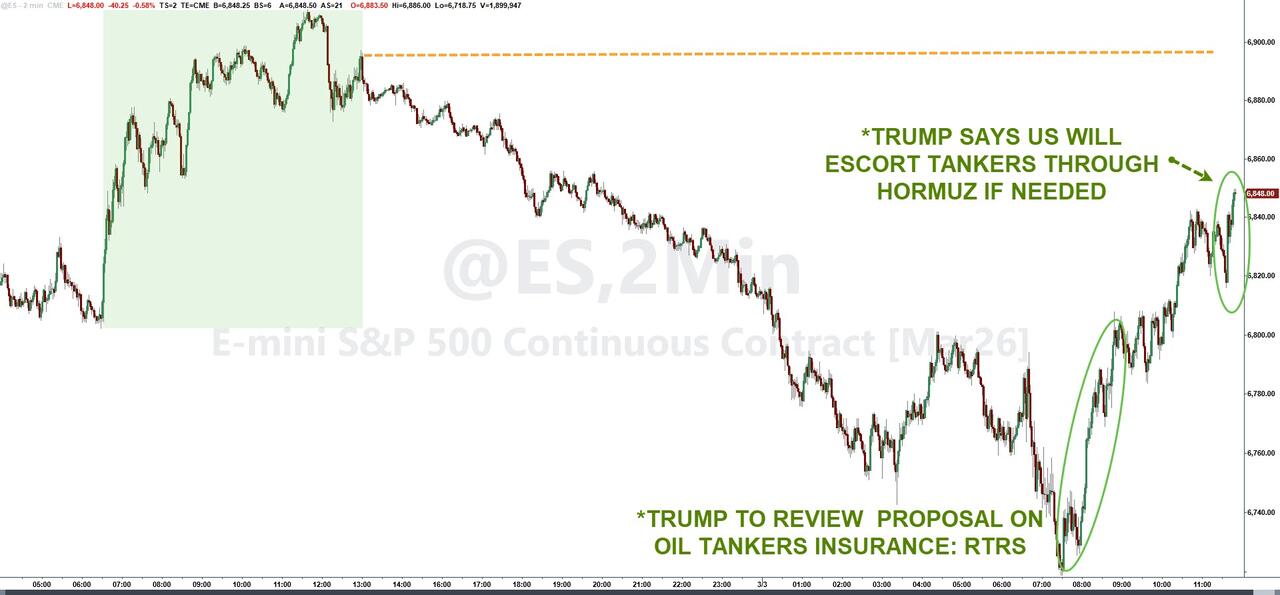
By the close, early losses had been trimmed quite a bit after President Trump floated the idea of helping oil tankers get insurance or escorts through the Strait of Hormuz if needed.
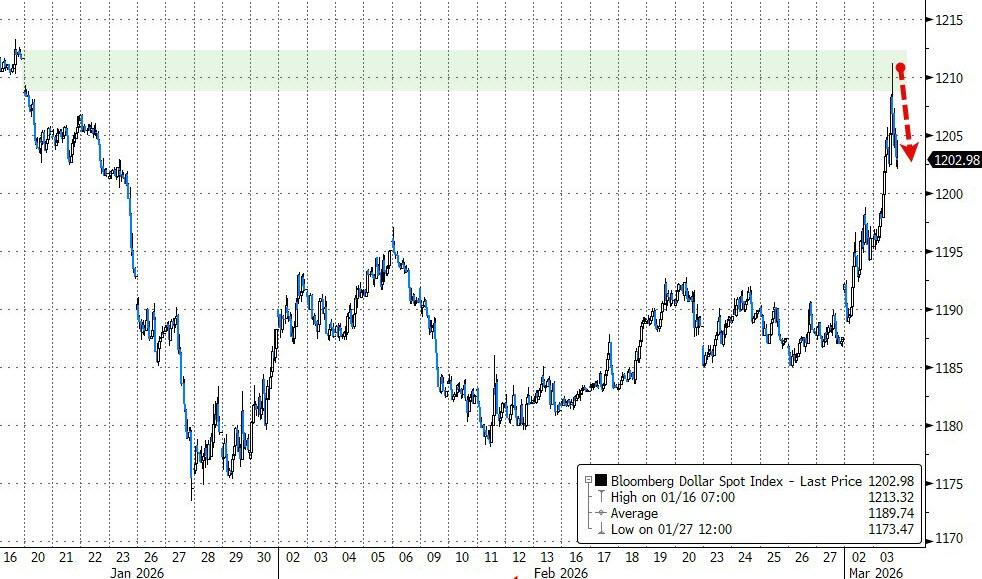
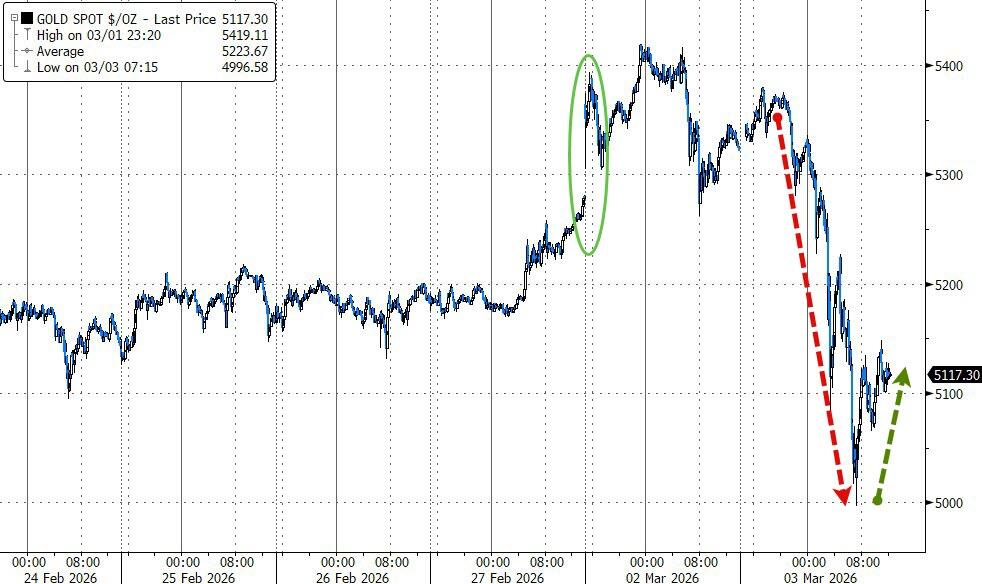
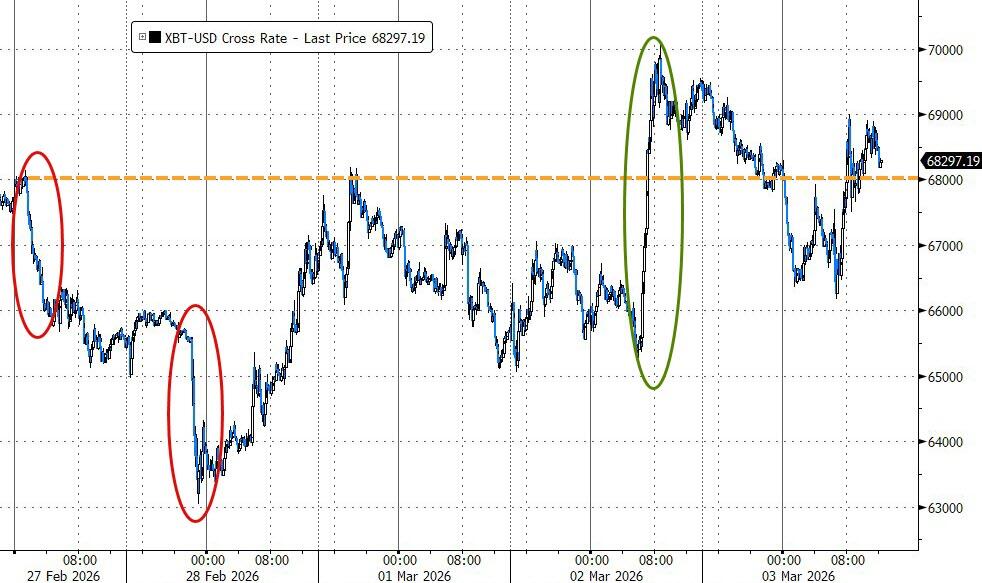
That eased some supply panic, pulling oil off its highs for now. The dollar spiked, gold gagged down to $5,000 before bouncing back, and Bitcoin rode its usual roller coaster but ended roughly unchanged since Friday.
With traders stressed and markets feeling fragile, all eyes are now on Friday’s jobs report—it could swing direction big time.
2. Current domestic “Buy” Cycle (effective 5/20/2025); International “Buy” Cycle (effective 5/8/25)
Our domestic bullish cycle that began on November 21, 2023, concluded on April 3, 2025, following a market downturn triggered by President Trump’s tariff policy announcement.
This development caused significant declines across major indexes and broader market indices. However, markets subsequently rebounded, culminating in a new domestic “Buy” signal taking effect May 20, 2025.
Concurrently, our International Trend Tracking Index (TTI) experienced parallel volatility. On April 4, 2025, it breached critical thresholds, prompting a “Sell” recommendation. This position reversed as global markets recovered, with the International TTI regaining sufficient momentum to issue a new “Buy” signal effective May 8, 2025.
3. Trend Tracking Indexes (TTIs)
The bears were completely in charge from the opening bell—no mercy, no reprieve.
Negative sentiment ruled the entire session, and every asset class got hammered, including the metals that usually hold up better. It was a true sea of red across the board, with literally nowhere to hide.
Our TTIs couldn’t escape the pressure either—they retreated along with everything else. The international one took the bigger hit, while the domestic one gave up less ground.
That said, both are still comfortably sitting on the bullish side of their long-term trend lines, so the bigger uptrend remains intact.
This is how we closed 03/03/2026:
Domestic TTI: +6.90% above its M/A (prior close +8.23%)—Buy signal effective 5/20/25.
International TTI: +8.83% above its M/A (prior close +11.30%)—Buy signal effective 5/8/25.
All linked charts above are courtesy of Bloomberg via ZeroHedge.
———————————————————-
WOULD YOU LIKE TO HAVE YOUR INVESTMENTS PROFESSIONALLY MANAGED?
Do you have the time to follow our investment plans yourself? If you are a busy professional who would like to have his portfolio managed using our methodology, please contact me directly to get more details.
Contact Ulli