- Moving the markets
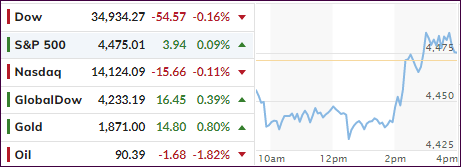
The major indexes took another opening dive and hovered at their low points for most of the day. Traders were anxiously waiting for the release of the latest FOMC minutes (January), which showed the Fed’s plan to accelerate interest rate hikes but without providing details about its Quantitative Tightening (QT) intentions. This lack of clarity was quickly interpreted as a positive and equities jumped and erased almost all early losses.
Endless articles appeared dissecting the Fed’s motives and reasoning, but suffice it to say that the released minutes did not show any information the markets were not aware of, which stoked the bullish crowd. Even the lack of explanation as to whether the rate liftoff would be via 0.25% or 0.5% did not affect the afternoon rebound.
On the economic front, we learned that “US Retail Sales exploded higher in January,” as ZH put it, which is its biggest MoM surge since March 2021. However, reading this data should be done with a word of caution:
All the retail sales data is nominal, and thus with CPI and PPI soaring near record highs, disseminating the real demand pull from the inflation push is all but impossible in deciding whether the consumer is ‘healthy’ and spending again.
Bond yields pulled back slightly, but the 10-remainded above its 2% level. The US Dollar continued yesterday’s slide, and gold recovered from Tuesday’s pullback and gained 0.84%.
In the end, it was breakeven day with not much gained and not much lost.
2. ETFs in the Spotlight
In case you missed the announcement and description of this section, you can read it here again.
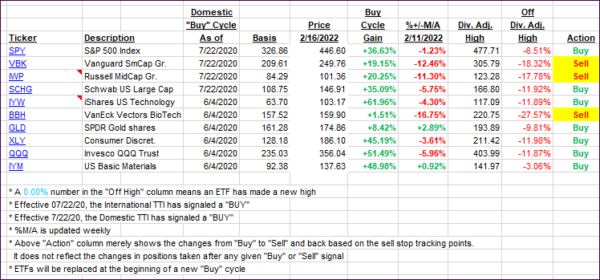
It features some of the 10 broadly diversified domestic and sector ETFs from my HighVolume list as posted every Saturday. Furthermore, they are screened for the lowest MaxDD% number meaning they have been showing better resistance to temporary sell offs than all others over the past year.
The below table simply demonstrates the magnitude with which these ETFs are fluctuating above or below their respective individual trend lines (%+/-M/A). A break below, represented by a negative number, shows weakness, while a break above, represented by a positive percentage, shows strength.
For hundreds of ETF choices, be sure to reference Thursday’s StatSheet.
For this current domestic “Buy” cycle, here’s how some of our candidates have fared:

Click image to enlarge.
Again, the %+/-M/A column above shows the position of the various ETFs in relation to their respective long-term trend lines, while the trailing sell stops are being tracked in the “Off High” column. The “Action” column will signal a “Sell” once the -12% point has been taken out in the “Off High” column, which has replaced the prior -8% to -10% limits.
3. Trend Tracking Indexes (TTIs)
Our TTIs staged a comeback after the early fall and gained slightly for the session.
This is how we closed 02/16/2022:
Domestic TTI: +1.63% above its M/A (prior close +1.30%)—Buy signal effective 07/22/2020.
International TTI: +4.11% above its M/A (prior close +3.75%)—Buy signal effective 07/22/2020.
Disclosure: I am obliged to inform you that I, as well as my advisory clients, own some of the ETFs listed in the above table. Furthermore, they do not represent a specific investment recommendation for you, they merely show which ETFs from the universe I track are falling within the specified guidelines.
All linked charts above are courtesy of Bloomberg via ZeroHedge.
Contact Ulli