- Moving the markets
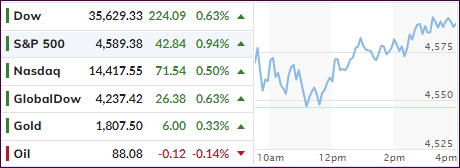
Another hard-fought battle for superiority at the unchanged line was won by the bulls today. After spending the first half of the session aimlessly meandering, the major indexes found some footing, and up we went. The gains were modest, but broad, nonetheless.
As I posted yesterday, “bad news is good news,” which was confirmed today when ADP signaled the biggest monthly job loss, since the 2020 Covid lockdowns, as ZH described like this:
So, after December’s big surprise surge in employment (+807k) led by a jump in Services jobs (which was very much absent in the payrolls data for that month), expectations were for ADP to print a considerably lower +180k for January… but as we suspected it was a huge miss with ADP printing a terrible 301k drop in jobs…
For sure, this bodes poorly for Friday’s jobs report, but that may just be what bullish traders are counting on, namely bad news that would keep the Fed from executing their tightening policy, therefore keeping the easy money flowing and supporting the markets.
Two stocks with opposing results dominated the news. First, we saw Google’s Alphabet surge higher by +10% on blowout earnings, while PayPal gagged and lost an astonishing -25%, which was its worst day on record.
Bond yields chopped around, with the 30-year closing just about unchanged. The US Dollar continued its losing streak for the third day and hovers at the unchanged level for the year.
Given current economic uncertainties, odds of a 0.5% interest rate hike in March are fading fast, as ZH pointed out. However, this has been the main driver to provide the bulls with the necessary ammunition for this most recent comeback.
2. ETFs in the Spotlight
In case you missed the announcement and description of this section, you can read it here again.
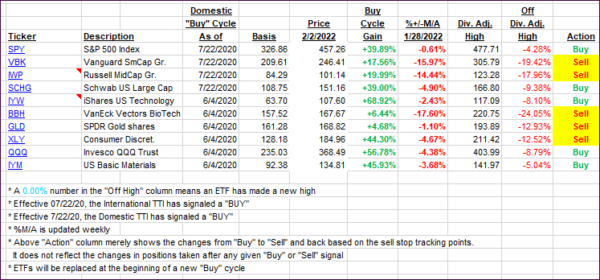
It features some of the 10 broadly diversified domestic and sector ETFs from my HighVolume list as posted every Saturday. Furthermore, they are screened for the lowest MaxDD% number meaning they have been showing better resistance to temporary sell offs than all others over the past year.
The below table simply demonstrates the magnitude with which these ETFs are fluctuating above or below their respective individual trend lines (%+/-M/A). A break below, represented by a negative number, shows weakness, while a break above, represented by a positive percentage, shows strength.
For hundreds of ETF choices, be sure to reference Thursday’s StatSheet.
For this current domestic “Buy” cycle, here’s how some of our candidates have fared:

Click image to enlarge.
Again, the %+/-M/A column above shows the position of the various ETFs in relation to their respective long-term trend lines, while the trailing sell stops are being tracked in the “Off High” column. The “Action” column will signal a “Sell” once the -12% point has been taken out in the “Off High” column, which has replaced the prior -8% to -10% limits.
3. Trend Tracking Indexes (TTIs)
Our TTIs joined the mid-day ramp and closed higher.
This is how we closed 02/02/2022:
Domestic TTI: +2.43 above its M/A (prior close +1.77%)—Buy signal effective 07/22/2020.
International TTI: +4.45% above its M/A (prior close +3.87%)—Buy signal effective 07/22/2020.
Disclosure: I am obliged to inform you that I, as well as my advisory clients, own some of the ETFs listed in the above table. Furthermore, they do not represent a specific investment recommendation for you, they merely show which ETFs from the universe I track are falling within the specified guidelines.
All linked charts above are courtesy of Bloomberg via ZeroHedge.
Contact Ulli