
- Moving the markets
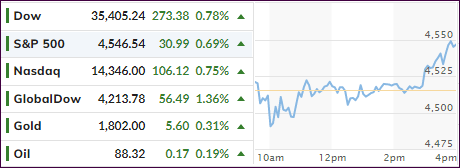
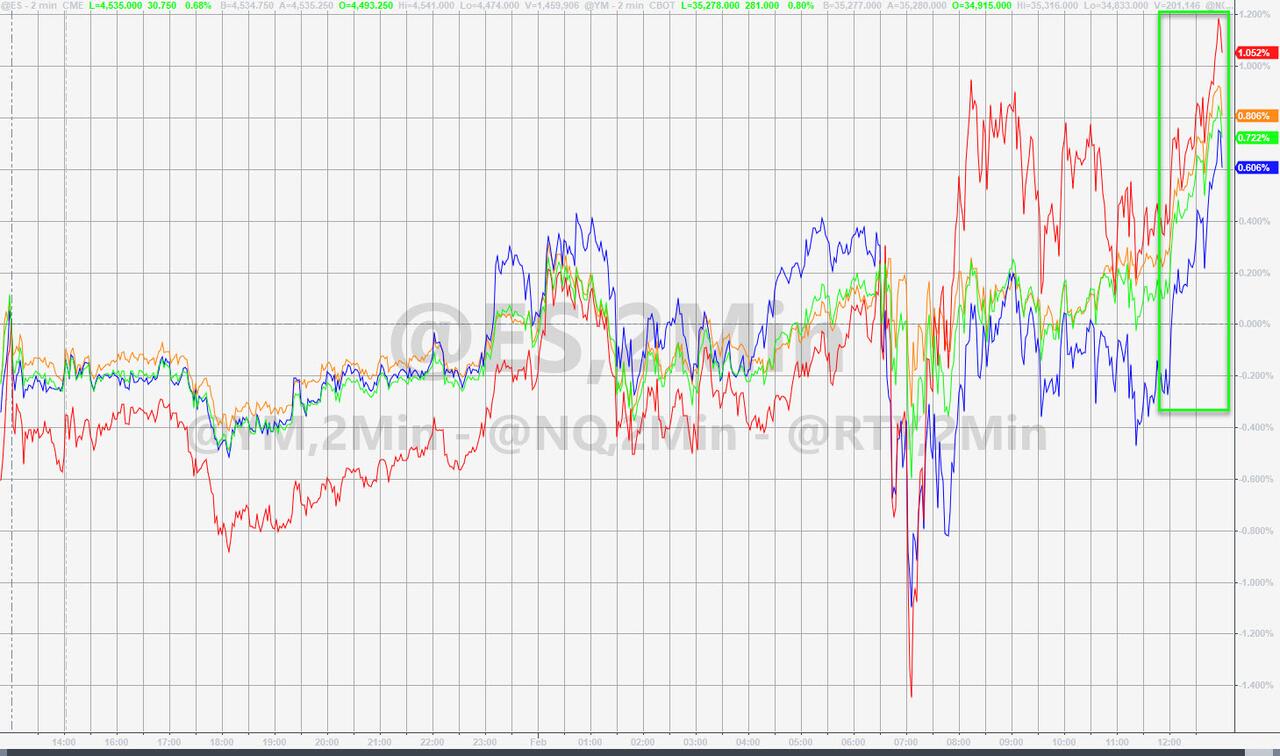
The major indexes meandered for most of the day looking for direction and found it during the last hour, as the attempt to climb back from January’s sell-off continued. Traders’ focus seemed to have suddenly changed from the Fed towards the earnings season and those companies’ beating expectations while issuing improved forward guidance.
At least that was the meme for the day, which may last only until that moment in time when the Fed steps up to the plate and reconfirms its readiness to tighten monetary policy.
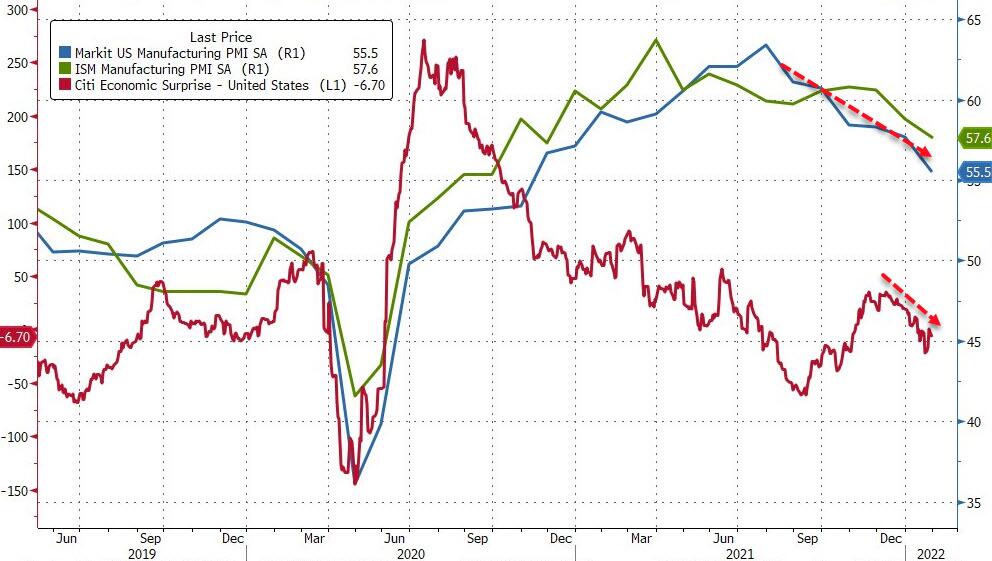
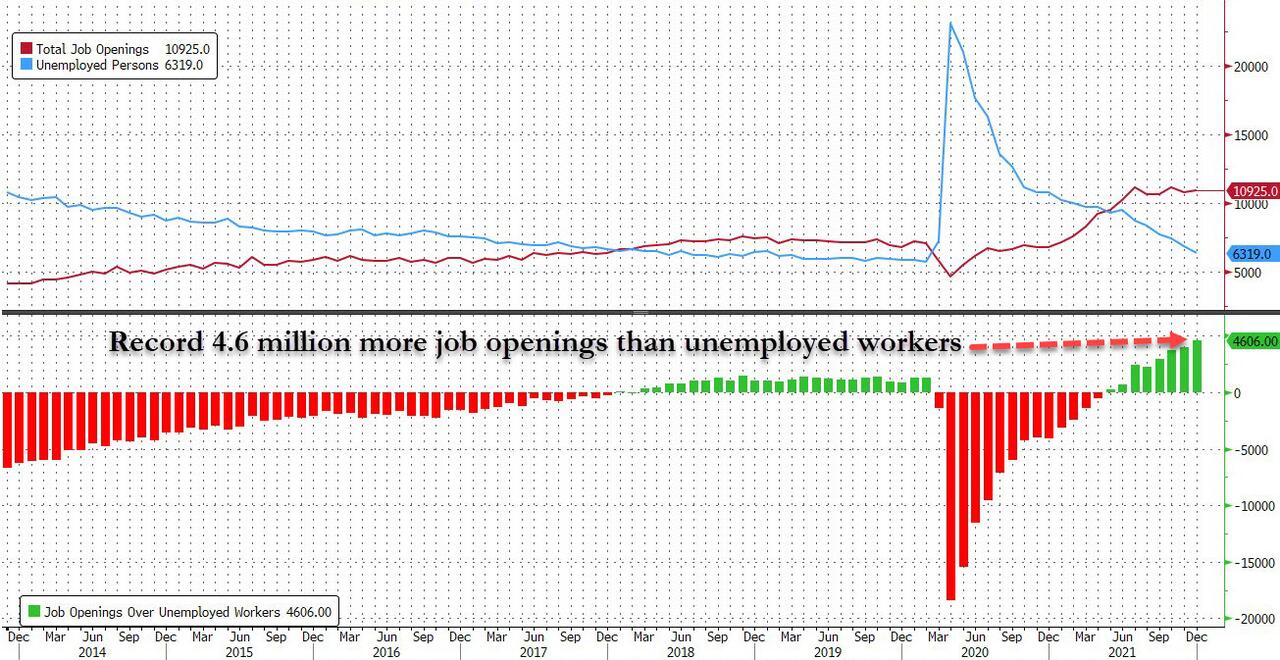
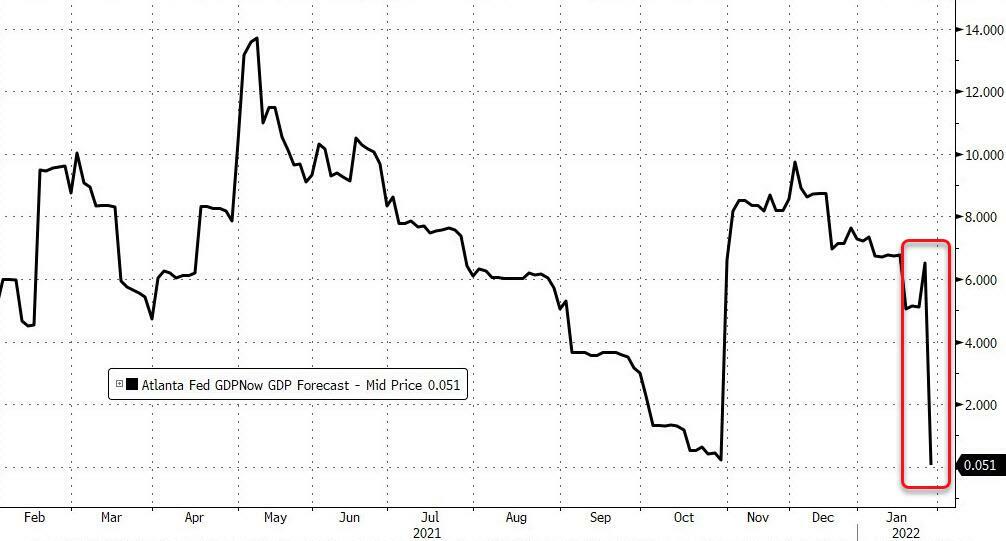
For sure, it was a session that lacked positives, as we learned that US Manufacturing weakened even more in January, which was followed by “Labor Insanity,” as ZH called it, which means that there are now a record 4.6 million more job openings than unemployed workers. Then investment powerhouse Goldman Sachs slashed its 2022 GDP forecast again, while warning of a “sharp deceleration in growth.”
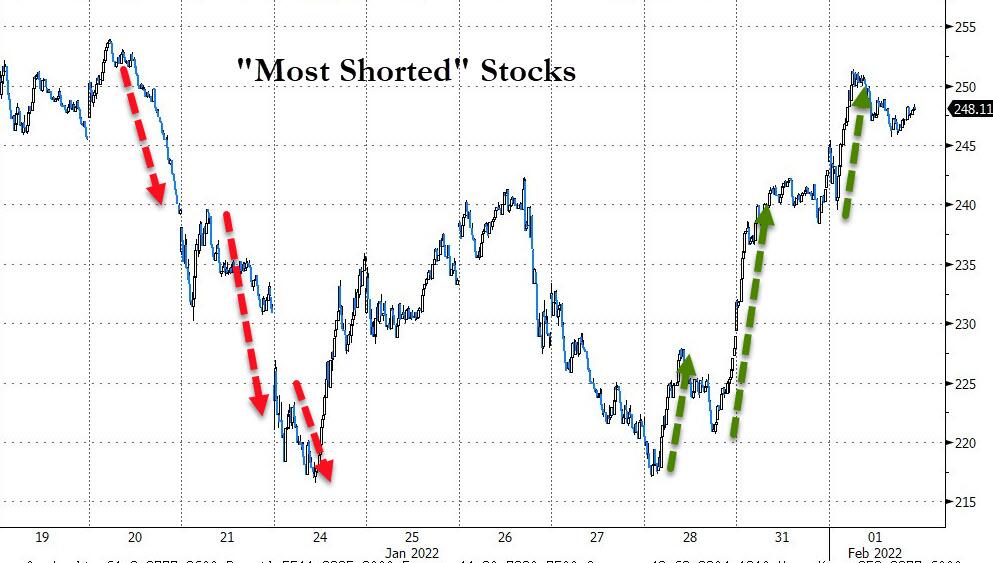
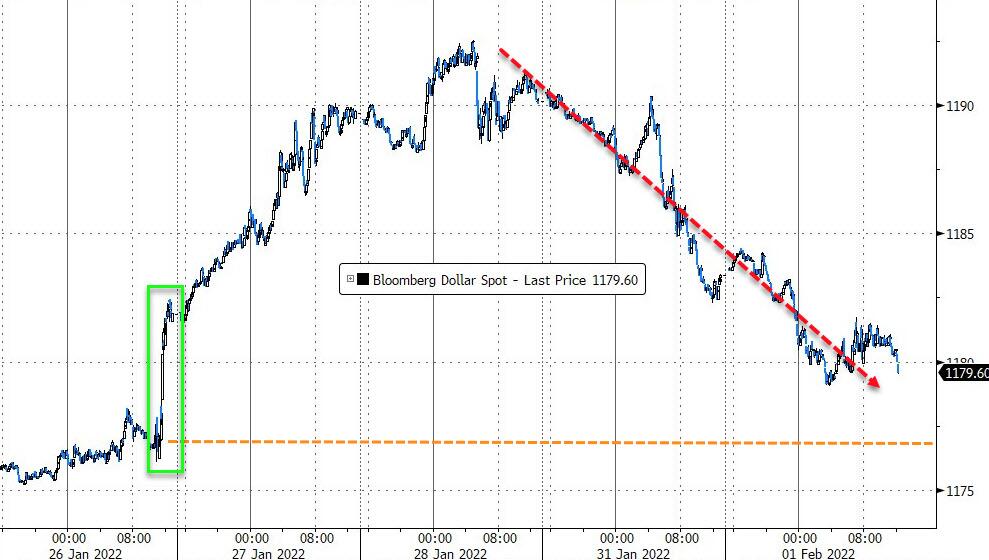
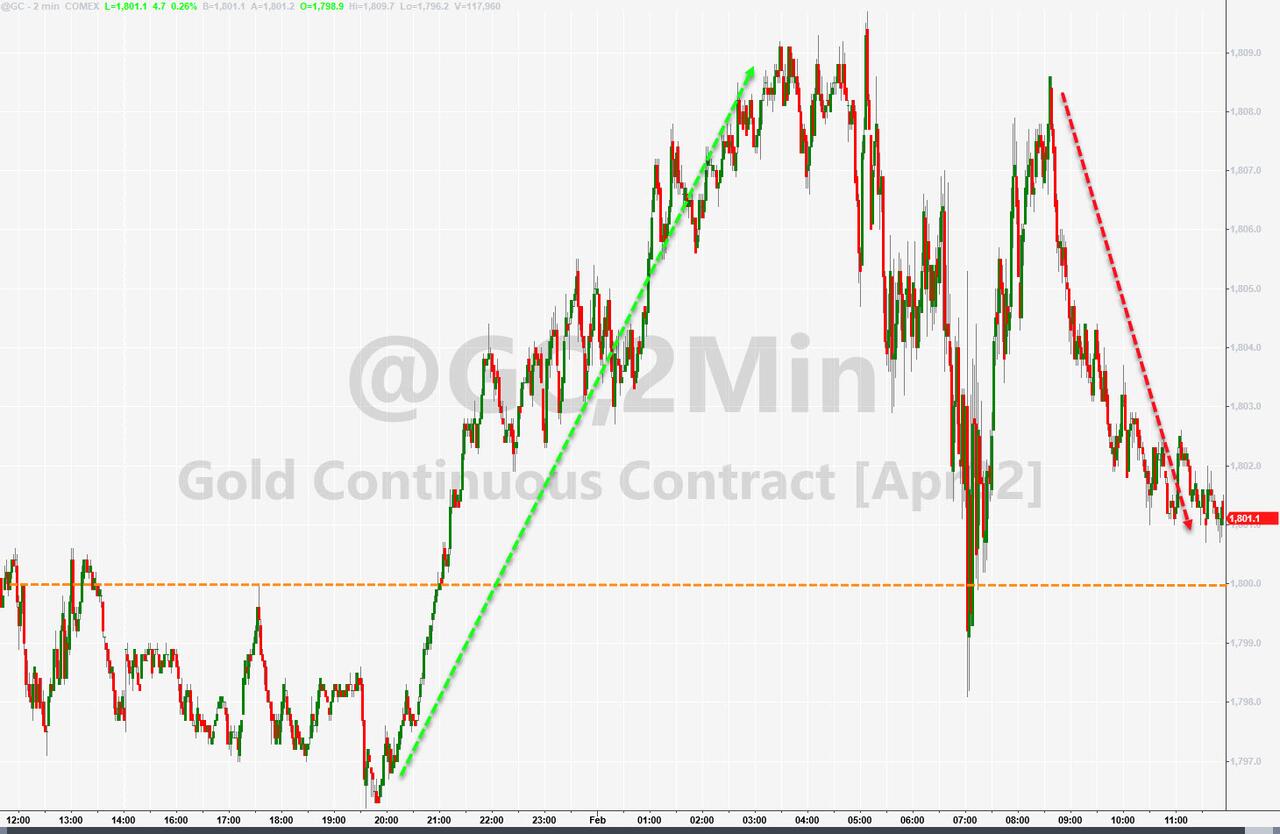
The most shorted stocks were squeezed again for the third day in a row and contributed to the rebound. The US Dollar continued its puke-a-thon and slipped off its January 28th highs, while Gold pumped and dumped but not only closed up but also reached its $1,800 level again.
And just maybe, we are seeing a repeat of the same old theme that says, ‘bad news is good news.’ In context to the above, it simply means that worsening economic data may sway the Fed from following through with their interest rate hiking agenda, thereby keeping their loose monetary policy intact.
That’s the hope on Wall Street.
2. ETFs in the Spotlight
In case you missed the announcement and description of this section, you can read it here again.
It features some of the 10 broadly diversified domestic and sector ETFs from my HighVolume list as posted every Saturday. Furthermore, they are screened for the lowest MaxDD% number meaning they have been showing better resistance to temporary sell offs than all others over the past year.
The below table simply demonstrates the magnitude with which these ETFs are fluctuating above or below their respective individual trend lines (%+/-M/A). A break below, represented by a negative number, shows weakness, while a break above, represented by a positive percentage, shows strength.
For hundreds of ETF choices, be sure to reference Thursday’s StatSheet.
For this current domestic “Buy” cycle, here’s how some of our candidates have fared:
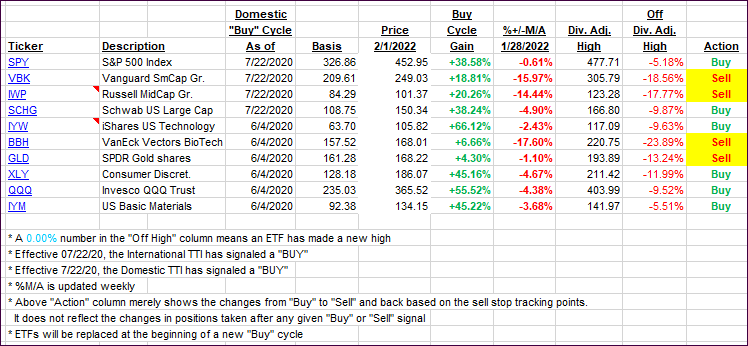
Click image to enlarge.
Again, the %+/-M/A column above shows the position of the various ETFs in relation to their respective long-term trend lines, while the trailing sell stops are being tracked in the “Off High” column. The “Action” column will signal a “Sell” once the -12% point has been taken out in the “Off High” column, which has replaced the prior -8% to -10% limits.
3. Trend Tracking Indexes (TTIs)
Our TTIs again went nowhere, until the markets bounced higher during the last hour, with the International one showing far more upside momentum. We have now seen the Domestic TTI staying above its trend line for the second straight day and will add more exposure, should this trend continue.
This is how we closed 02/01/2022:
Domestic TTI: +1.77 above its M/A (prior close +0.95%)—Buy signal effective 07/22/2020.
International TTI: +3.87% above its M/A (prior close +1.39%)—Buy signal effective 07/22/2020.
Disclosure: I am obliged to inform you that I, as well as my advisory clients, own some of the ETFs listed in the above table. Furthermore, they do not represent a specific investment recommendation for you, they merely show which ETFs from the universe I track are falling within the specified guidelines.
All linked charts above are courtesy of Bloomberg via ZeroHedge.
Contact Ulli