
- Moving the markets
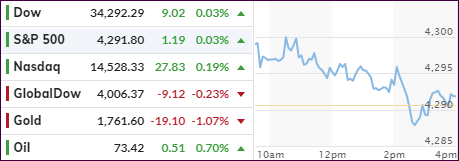
Despite an early morning bounce, the Dow and the S&P 500 succumbed to weakness and gave back most of their initial gains and ended essentially unchanged. The Nasdaq went the other way but managed to climb out of a hole to score a modest gain, after swinging wildly late in the session.
It appeared to be a day of rest for the indexes with low volatility keeping markets in check, despite strong readings form home prices and consumer confidence.
Added CNBC:
The market has churned out a series of record highs in recent weeks, but the gains have been relatively modest, and some strategists have pointed to weak market breadth, measured by the performance of average stocks and the number of individual names making new highs, as a potential area of concern.
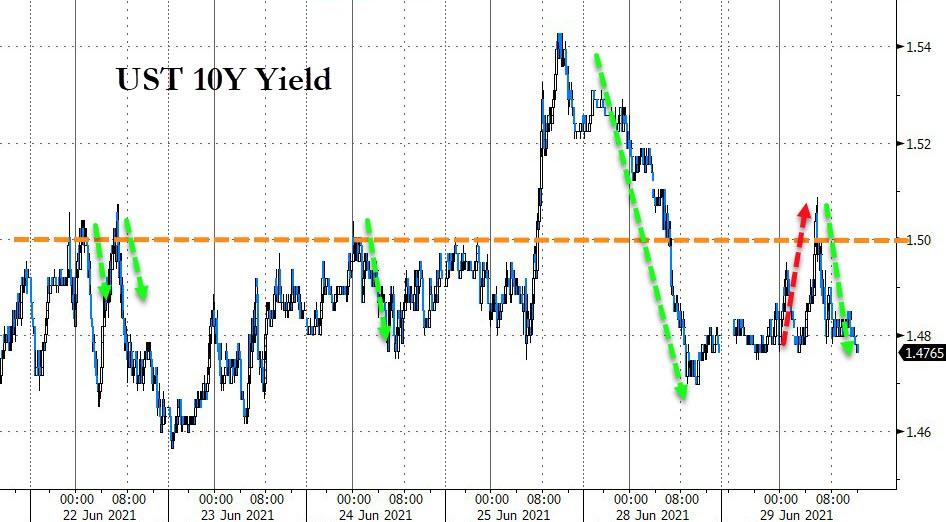
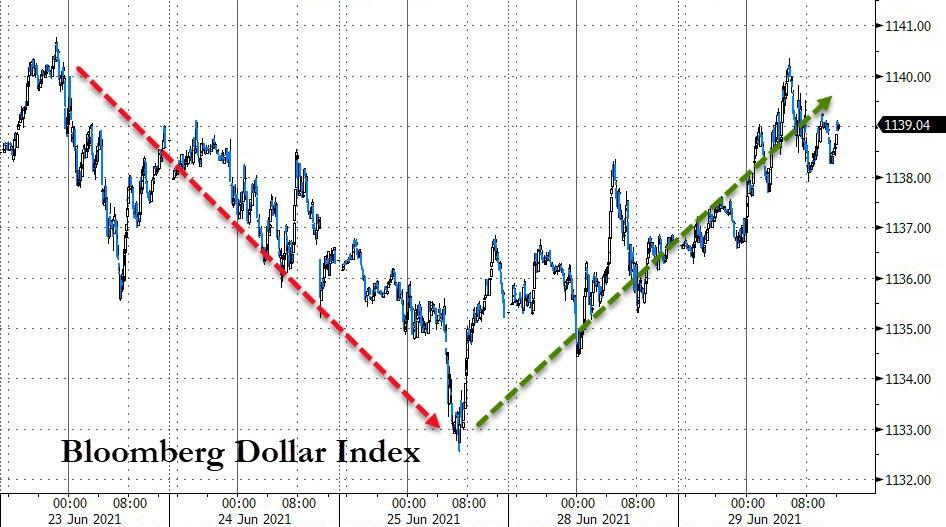
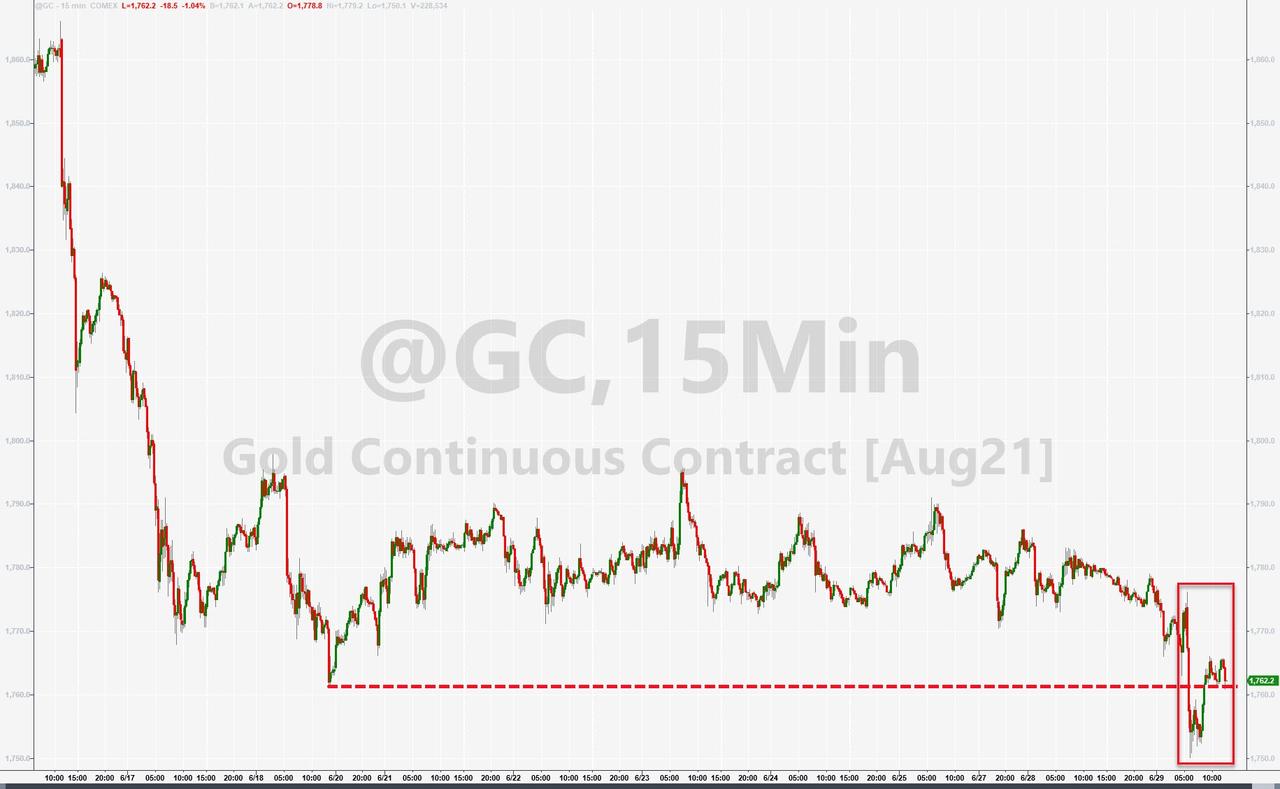
Bond yields rode the rollercoaster and ended slightly down, while the US Dollar Index continued its rebound but failed to take out last week’s highs. None of this action assisted Gold, with the precious metal breaking beneath recent lows but bouncing into the close.
It was another session during which not much was gained and not much was lost.
2. ETFs in the Spotlight
In case you missed the announcement and description of this section, you can read it here again.
It features some of the 10 broadly diversified domestic and sector ETFs from my HighVolume list as posted every Saturday. Furthermore, they are screened for the lowest MaxDD% number meaning they have been showing better resistance to temporary sell offs than all others over the past year.
The below table simply demonstrates the magnitude with which these ETFs are fluctuating above or below their respective individual trend lines (%+/-M/A). A break below, represented by a negative number, shows weakness, while a break above, represented by a positive percentage, shows strength.
For hundreds of ETF choices, be sure to reference Thursday’s StatSheet.
For this current domestic “Buy” cycle, here’s how some our candidates have fared:
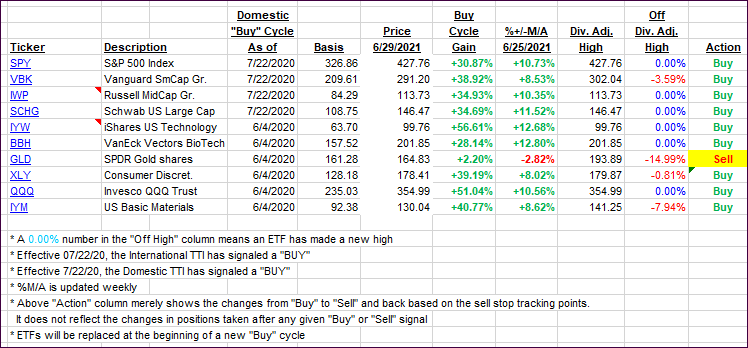
Click image to enlarge.
Again, the %+/-M/A column above shows the position of the various ETFs in relation to their respective long-term trend lines, while the trailing sell stops are being tracked in the “Off High” column. The “Action” column will signal a “Sell” once the -8% point has been taken out in the “Off High” column. For more volatile sector ETFs, the trigger point is -10%.
3. Trend Tracking Indexes (TTIs)
Our TTIs slipped a bit as the markets went nowhere.
This is how we closed 06/29/2021:
Domestic TTI: +12.97% above its M/A (prior close +13.05%)—Buy signal effective 07/22/2020.
International TTI: +10.43% above its M/A (prior close +10.66%)—Buy signals effective 07/22/2020.
Disclosure: I am obliged to inform you that I, as well as my advisory clients, own some of the ETFs listed in the above table. Furthermore, they do not represent a specific investment recommendation for you, they merely show which ETFs from the universe I track are falling within the specified guidelines.
All linked charts above are courtesy of Bloomberg via ZeroHedge.
Contact Ulli