- Moving the markets
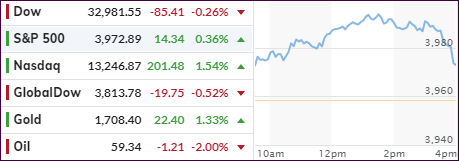
The S&P 500 made a valiant effort to reach its magic 4,000 mark but fell short yet scored its best month since November. Today, it seemed like the rotation was back into the tech sector with the Nasdaq popping 1.52%, while the S&P was helped higher due to its tech heavy components.
Giving an assist was Biden’s big infrastructure plan, despite not only the negative connotations because of increased tax rates for corporations but also due to the closure of a variety of tax loopholes.
Regardless of the tech sector’s resurgence today, for the quarter it has been the laggard with a gain of 3% vs. the Dow’s and S&P’s 8% and 6.2% respectively. CNBC explained the reason this way:
The Nasdaq has been the relative underperformer as technology stocks are especially sensitive to rising rates because they depend on borrowing money cheaply to invest in their future growth.
Traders and investors alike are concerned about the possible negative impact of the massive stimulus/infrastructure plan with Tom Essaye of Sevens Report pointing straight to the underlying issues:
“Economic stimulus is no longer 100% virtuous in the eyes of the market, that’s because it will bring with it 1) Higher yields, 2) Rising inflation expectations and 3) Erosion of the idea that the Fed will be on hold for the entirety of 2021. Additionally, all this stimulus is being used to offset and usher in tax increases on individuals, corporations and investments.”
Well said, but I believe that the initial reaction will be positive for some market sectors, which we try to get exposure in.
Despite bond yields inching higher, the US Dollar was just about unchanged, which allowed GLD to finally have a decent showing by gaining +1.52%.
Concerns still abound that volatility might pick up over the next week due to large 60/40 funds having to adjust their holdings back to model on a massive scale, according to JPM. The reason is that US stocks have dramatically outperformed US Treasuries, as Bloomberg shows here.
So far, none of this forced month-end selling has materialized.
3. ETFs in the Spotlight
In case you missed the announcement and description of this section, you can read it here again.
It features some of the 10 broadly diversified domestic and sector ETFs from my HighVolume list as posted every Saturday. Furthermore, they are screened for the lowest MaxDD% number meaning they have been showing better resistance to temporary sell offs than all others over the past year.
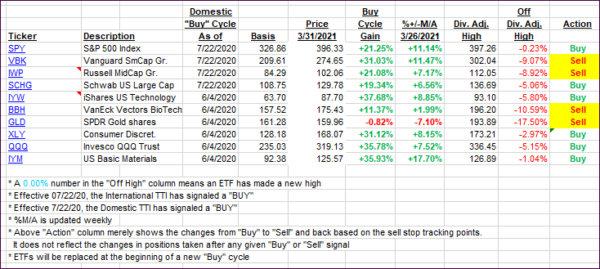
The below table simply demonstrates the magnitude with which these ETFs are fluctuating above or below their respective individual trend lines (%+/-M/A). A break below, represented by a negative number, shows weakness, while a break above, represented by a positive percentage, shows strength.
For hundreds of ETF choices, be sure to reference Thursday’s StatSheet.
For this current domestic “Buy” cycle, here’s how some our candidates have fared:

Click image to enlarge.
Again, the %+/-M/A column above shows the position of the various ETFs in relation to their respective long-term trend lines, while the trailing sell stops are being tracked in the “Off High” column. The “Action” column will signal a “Sell” once the -8% point has been taken out in the “Off High” column. For more volatile sector ETFs, the trigger point is -10%.
3. Trend Tracking Indexes (TTIs)
Our TTIs changed slightly, however, the International one was far more volatile than the Domestic arena.
This is how we closed 3/31/2021:
Domestic TTI: +18.69% above its M/A (prior close +18.73%)—Buy signal effective 07/22/2020.
International TTI: +15.79% above its M/A (prior close +16.38%)—Buy signals effective 07/22/2020.
Disclosure: I am obliged to inform you that I, as well as my advisory clients, own some of the ETFs listed in the above table. Furthermore, they do not represent a specific investment recommendation for you, they merely show which ETFs from the universe I track are falling within the specified guidelines.
Contact Ulli