
- Moving the markets
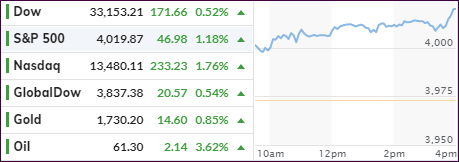
The major indexes greeted the month of April with a bang and a solid close in the green. The Dow lagged somewhat, but the S&P 500 made up for it by conquering its 4,000-milestone marker without hesitation.
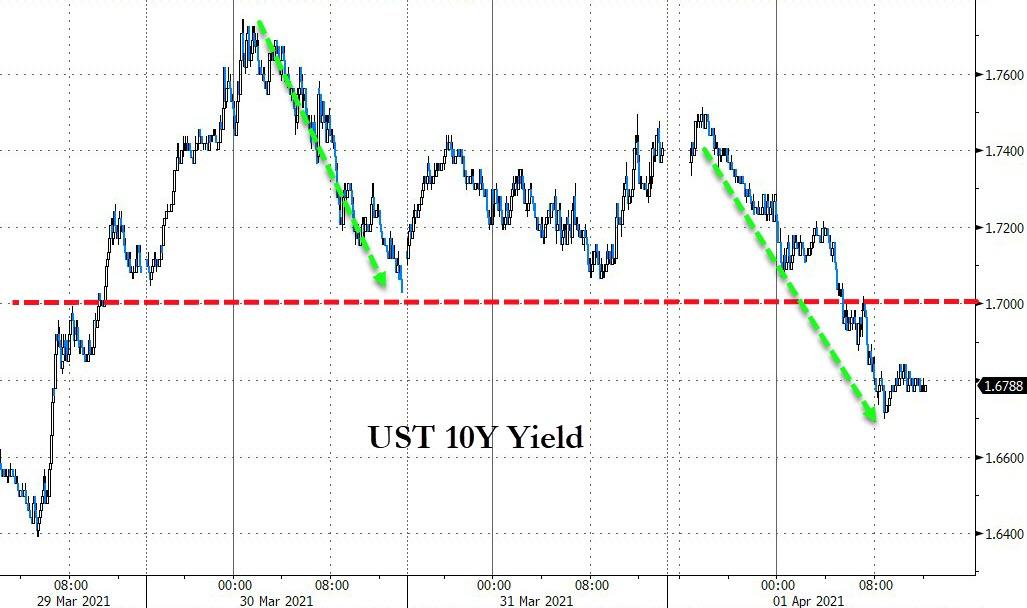
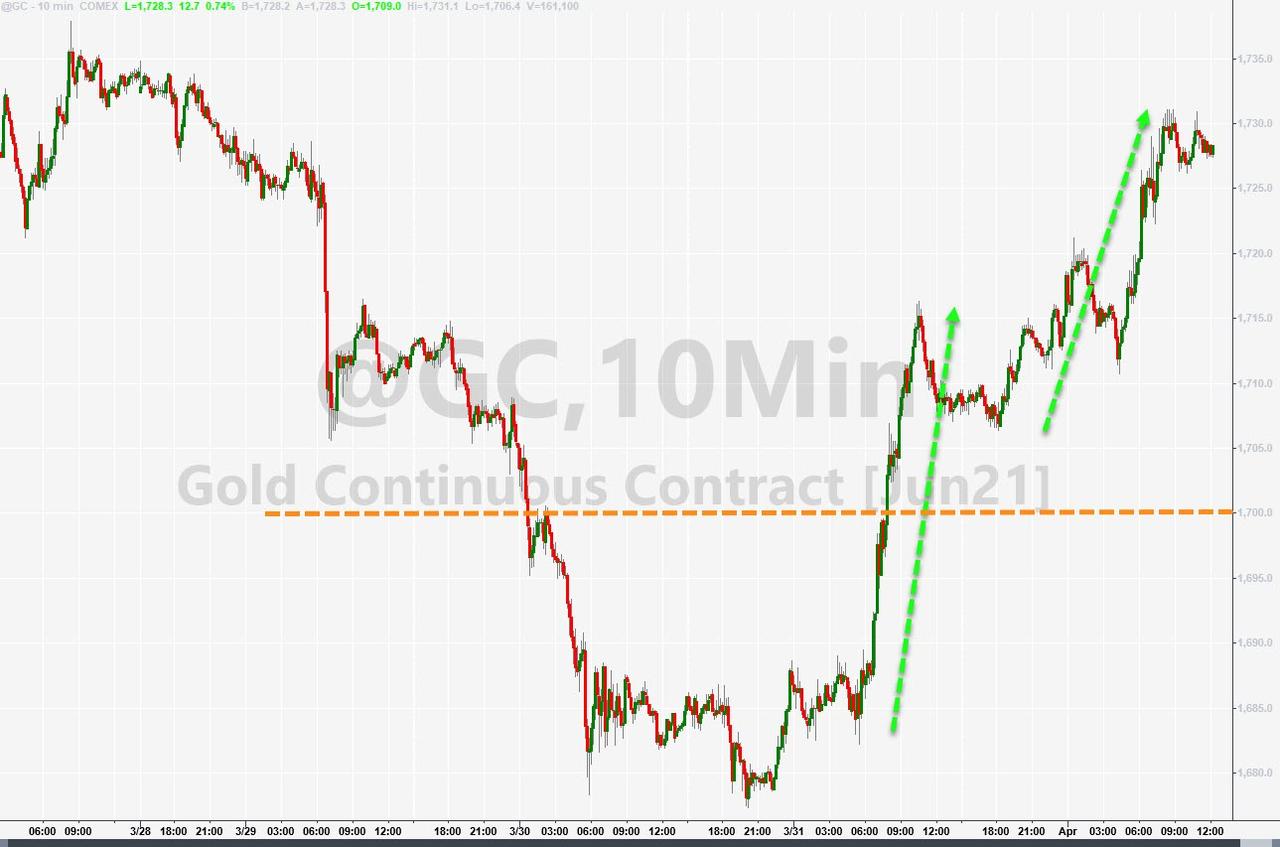
Tech stocks took the lead today and were powered by lower bond yields and a declining US Dollar, both of which combined to push gold higher with the GLD ETF adding a robust +1.27%.
The continued but spotty reopening of the US economy was a positive for equities, but concerns linger as to when we might reach the end of the coronavirus tunnel. However, the main driver is the ongoing reckless fiscal and monetary support, which is unprecedented and presents potential consequences that nobody likes to address.
On the other hand, higher taxes could pose a threat to corporate earnings and subsequently to stock prices. These concerns, while present, are largely ignored with most traders focusing on the more immediate benefit like maintaining the bullish theme.
On the economic front, the main number for the day, namely first-time filings for jobless benefits, rose from the prior week’s 684k to 719k. In other words, there is no consistent improvement other than an occasional temporary drop. Looking at the big picture, there are still over 18 million Americans getting jobless benefits. Ouch!
Tomorrow, Good Friday, the markets will be closed, but the Payroll Report announcement will be on deck. The only asset class, which will trade until noon are bonds, and they might respond in a big way (negatively), should the report hit the whisper number of 1.8 million, which would be triple the expectations. In that case, Monday’s session might see fireworks.
2. ETFs in the Spotlight
In case you missed the announcement and description of this section, you can read it here again.
It features some of the 10 broadly diversified domestic and sector ETFs from my HighVolume list as posted every Saturday. Furthermore, they are screened for the lowest MaxDD% number meaning they have been showing better resistance to temporary sell offs than all others over the past year.
The below table simply demonstrates the magnitude with which these ETFs are fluctuating above or below their respective individual trend lines (%+/-M/A). A break below, represented by a negative number, shows weakness, while a break above, represented by a positive percentage, shows strength.
For hundreds of ETF choices, be sure to reference Thursday’s StatSheet.
For this current domestic “Buy” cycle, here’s how some our candidates have fared:
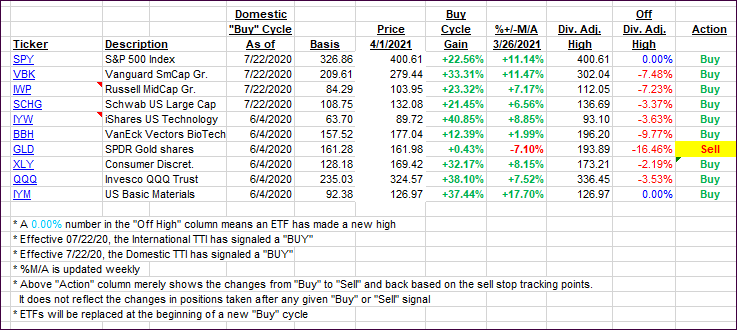
Click image to enlarge.
Again, the %+/-M/A column above shows the position of the various ETFs in relation to their respective long-term trend lines, while the trailing sell stops are being tracked in the “Off High” column. The “Action” column will signal a “Sell” once the -8% point has been taken out in the “Off High” column. For more volatile sector ETFs, the trigger point is -10%.
3. Trend Tracking Indexes (TTIs)
Our TTIs joined the rally.
This is how we closed 04/01/2021:
Domestic TTI: +19.88% above its M/A (prior close +18.69%)—Buy signal effective 07/22/2020.
International TTI: +16.51% above its M/A (prior close +15.79%)—Buy signals effective 07/22/2020.
Disclosure: I am obliged to inform you that I, as well as my advisory clients, own some of the ETFs listed in the above table. Furthermore, they do not represent a specific investment recommendation for you, they merely show which ETFs from the universe I track are falling within the specified guidelines.
Contact Ulli