- Moving the markets
The tech sector was “saved” last night during futures trading when China’s Plunge Protection team tried to intervene and shore up their markets. While it helped to erase some of the early losses, it was it was not enough for a total comeback.
But—it halted Monday’s tech beating, sent the US indexes higher and helped bond yields to slip back to the 1.52% area (10-year) from 1.60%. That set the sentiment index back to bullish, and the regular session started with a bang with the beaten down Nasdaq being today’s main beneficiary with a gain of +3.69%.
As ZH speculated, it seems like the Nasdaq’s drop of some 10%, and today’s bounce of its 100 DMA, may have been the red line in the sand for the world’s Central Banks—”no more than 10% drawdowns and life is good.”
Added CNBC:
Many popular technology stocks have fallen double digits over the past month amid rate fears. Even with Tuesday’s rally, Apple dropped more than 10% in the past month, while Tesla tumbled 20%. Pandemic bets Zoom Video and Peloton fell 20% and 36%, respectively, during the same period.
With bond yields retreating, along with the US Dollar, it’s no surprise that Gold finally showed some signs of life with the GLD ETF rallying a strong +2.13%.
To me, the question now is this one: “Are we seeing the end of the tech wreck or merely a dead-cat-bounce?” Of course, only over time will we know the answer.
2. ETFs in the Spotlight
In case you missed the announcement and description of this section, you can read it here again.
It features some of the 10 broadly diversified domestic and sector ETFs from my HighVolume list as posted every Saturday. Furthermore, they are screened for the lowest MaxDD% number meaning they have been showing better resistance to temporary sell offs than all others over the past year.
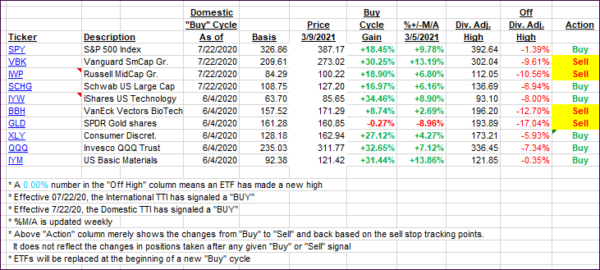
The below table simply demonstrates the magnitude with which these ETFs are fluctuating above or below their respective individual trend lines (%+/-M/A). A break below, represented by a negative number, shows weakness, while a break above, represented by a positive percentage, shows strength.
For hundreds of ETF choices, be sure to reference Thursday’s StatSheet.
For this current domestic “Buy” cycle, here’s how some our candidates have fared:

Click image to enlarge.
Again, the %+/-M/A column above shows the position of the various ETFs in relation to their respective long-term trend lines, while the trailing sell stops are being tracked in the “Off High” column. The “Action” column will signal a “Sell” once the -8% point has been taken out in the “Off High” column. For more volatile sector ETFs, the trigger point is -10%.
3. Trend Tracking Indexes (TTIs)
Our TTIs rose a tiny bit due to today’s rally being predominantly focused on the tech sector.
This is how we closed 3/9/2021:
Domestic TTI: +18.39% above its M/A (prior close +18.22%)—Buy signal effective 07/22/2020.
International TTI: +17.53% above its M/A (prior close +16.97%)—Buy signals effective 07/22/2020.
Disclosure: I am obliged to inform you that I, as well as my advisory clients, own some of the ETFs listed in the above table. Furthermore, they do not represent a specific investment recommendation for you, they merely show which ETFs from the universe I track are falling within the specified guidelines.
Contact Ulli