
- Moving the markets
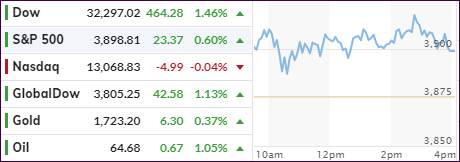
It was a tale of two markets again with the Dow ending in record territory, while the Nasdaq, after strong early gains, fell apart and closed slightly in the red. The S&P 500 closed +0.60%, but the larger gains occurred in the value sector, namely RPV with +2.25% and IJS with +2.33%; both are ETFs which we own.
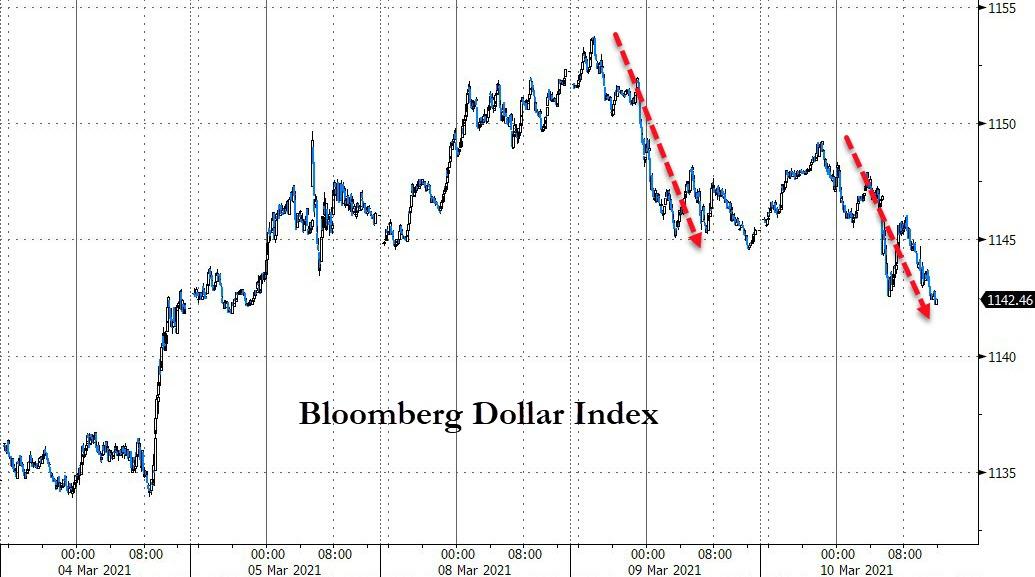
Gold held up well for the second day in a row, supported by slipping bond yields and a dumping US Dollar. The $1.9 trillion stimulus package jokingly also referred to as “the bucket of lard,” was passed today by the Democrats. It spurred bullish momentum based on the assumption that stocks will benefit from a faster recovery from Covid-19 due to more money in circulation.
The Labor Department announced that consumer prices (CPI) increased 0.4% in February, in line with expectations.
Added Art Hogan of National Securities:
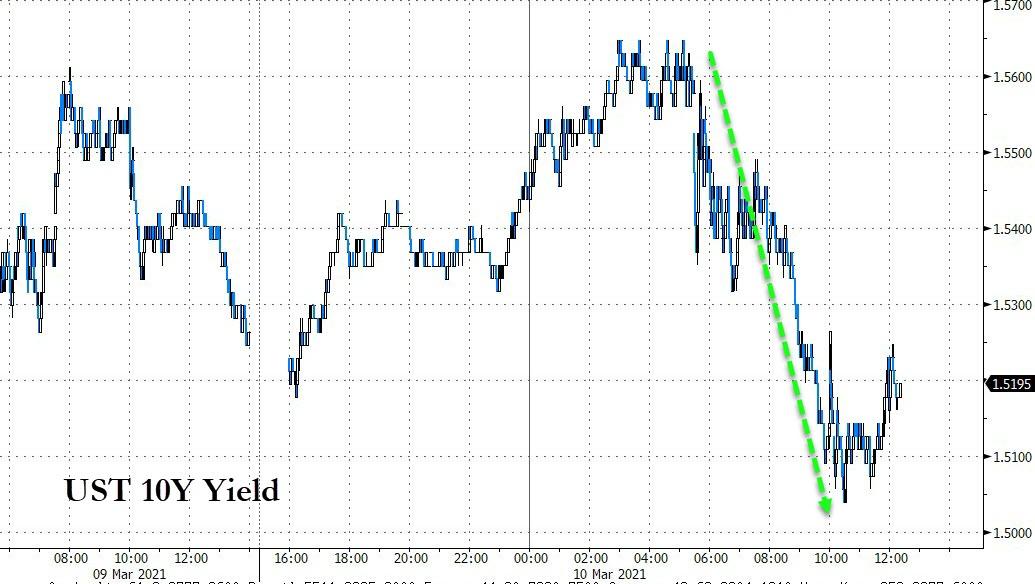
“The biggest concern that markets have had over the last month or so has been inflation running hotter than we estimate. Clearly CPI puts that to rest, at least for today, the yield on the 10-year has ceased going parabolic.”
Also helping matters was the widely watched 10-year Treasury auction, which was met with adequate demand and eased traders’ concerns that the ever-increasing debt burden would be too much for the market to absorb and might force yields even higher.
That was the perception today. I don’t think we’ve seen the end of sudden bond surges, but at least for today the players were pacified.
2. ETFs in the Spotlight
In case you missed the announcement and description of this section, you can read it here again.
It features some of the 10 broadly diversified domestic and sector ETFs from my HighVolume list as posted every Saturday. Furthermore, they are screened for the lowest MaxDD% number meaning they have been showing better resistance to temporary sell offs than all others over the past year.
The below table simply demonstrates the magnitude with which these ETFs are fluctuating above or below their respective individual trend lines (%+/-M/A). A break below, represented by a negative number, shows weakness, while a break above, represented by a positive percentage, shows strength.
For hundreds of ETF choices, be sure to reference Thursday’s StatSheet.
For this current domestic “Buy” cycle, here’s how some our candidates have fared:
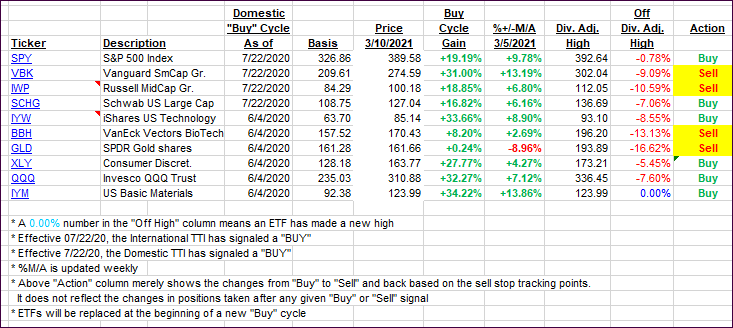
Click image to enlarge.
Again, the %+/-M/A column above shows the position of the various ETFs in relation to their respective long-term trend lines, while the trailing sell stops are being tracked in the “Off High” column. The “Action” column will signal a “Sell” once the -8% point has been taken out in the “Off High” column. For more volatile sector ETFs, the trigger point is -10%.
3. Trend Tracking Indexes (TTIs)
Our TTIs closed up as the broad market advanced with the Nasdaq surrendering all of its early gains.
This is how we closed 3/10/2021:
Domestic TTI: +19.60% above its M/A (prior close +18.39%)—Buy signal effective 07/22/2020.
International TTI: +18.38% above its M/A (prior close +17.53%)—Buy signals effective 07/22/2020.
Disclosure: I am obliged to inform you that I, as well as my advisory clients, own some of the ETFs listed in the above table. Furthermore, they do not represent a specific investment recommendation for you, they merely show which ETFs from the universe I track are falling within the specified guidelines.
Contact Ulli