- Moving the markets
The markets dug themselves an early hole and never managed to climb out of it, despite several attempts. But, in the end downside momentum accelerated, and we closed at the lows for the day.
The futures again pointed to weakness with Germany and France set to impose new lockdowns in addition to the restrictions that tens of millions in the U.K., Italy and Spain are already experiencing. Infections are rising not only in Europe but globally thereby stoking fears that the lockdown revivals will kill off the recent nascent economic recovery.
U.S. coronavirus cases have risen by a record daily average of 71,832 over the past week, data compiled by Johns Hopkins University showed. Meanwhile, coronavirus-related hospitalizations are up 5% or more in three dozen states, according to data from the Covid Tracking Project. Cases are also rising sharply across Europe.
In the meantime, earnings season continues, which, in general is coming in better than expected but, disappointingly, a lot of companies are not providing future guidance, which impacts confidence in their ability to deliver acceptable numbers next quarter.
During this session we saw the Volatility Index (VIX) spike to 40 for the first time since June, as ZH reported. Keep in mind that the big boys on Wall Street are highly leveraged, which caused a liquidity crisis today, as everything that was not nailed down was sold to cover margin calls.
That included gold which, however, fared far better than equities, but the precious metal was also hurt by rising bond yields and a spiking US dollar.
Even the 60/40 stock/bond allocation fans saw their model not reacting as it should during sell offs, meaning that, as stocks got hammered, bond yields should have dropped but didn’t, thereby causing additional losses rather than gains, as Bloomberg’s chart shows.
Our Trend Tracking Indexes (TTIs, section 3) headed south as well yet remain in bullish territory, “but for how long?” remains the question.
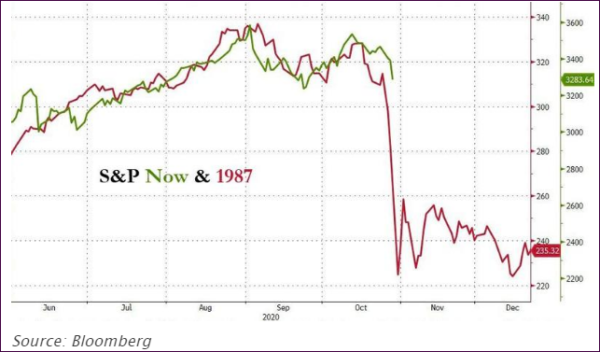
If the below updated analog to 1987 continues to hold up, we may have the answer soon:

2. ETFs in the Spotlight
In case you missed the announcement and description of this section, you can read it here again.
It features some of the 10 broadly diversified domestic and sector ETFs from my HighVolume list as posted every Saturday. Furthermore, they are screened for the lowest MaxDD% number meaning they have been showing better resistance to temporary sell offs than all others over the past year.
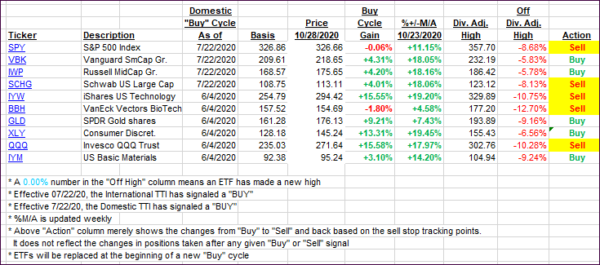
The below table simply demonstrates the magnitude with which these ETFs are fluctuating above or below their respective individual trend lines (%+/-M/A). A break below, represented by a negative number, shows weakness, while a break above, represented by a positive percentage, shows strength.
For hundreds of ETF choices, be sure to reference Thursday’s StatSheet.
For this current domestic “Buy” cycle, here’s how some our candidates have fared:

Click image to enlarge
Again, the %+/-M/A column above shows the position of the various ETFs in relation to their respective long-term trend lines, while the trailing sell stops are being tracked in the “Off High” column. The “Action” column will signal a “Sell” once the -8% point has been taken out in the “Off High” column. For more volatile sector ETFs, the trigger point is -10%.
3. Trend Tracking Indexes (TTIs)
Our TTIs headed sharply south with especially the International TTI showing more weakness than its domestic cousin.
This is how we closed 10/28/2020:
Domestic TTI: +4.41% above its M/A (prior close +7.71%)—Buy signal effective 07/22/2020
International TTI: +1.08% above its M/A (prior close +4.31%)—Buy signal effective 07/22/2020
Disclosure: I am obliged to inform you that I, as well as my advisory clients, own some of the ETFs listed in the above table. Furthermore, they do not represent a specific investment recommendation for you, they merely show which ETFs from the universe I track are falling within the specified guidelines.
Contact Ulli