
- Moving the markets
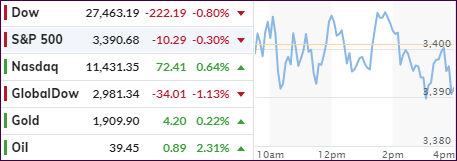
One look at the S&P 500 chart above shows the lack of direction and the aimless meandering that underscored today’s session with 2 of the 3 major indexes closing in the red by a small margin.
If I am repeating myself, it’s only because the same issues are plaguing the markets, rising coronavirus cases and the lack of any stimulus agreement, although the latter has temporarily moved out of the spotlight in favor of speculation as to how the different election outcomes would affect the direction of equities.
There are as many opinions as there are blogs to host them, but my preference is generally the sound reasoning by analyst and money manager Peter Schiff, who opined as follows:
“And of course, if all of the people who are staying at home and shopping never go back to work and never actually have a job, and the only money they have to spend is the money the Fed creates out of thin air, eventually the dollar is going to collapse and their real purchasing power is going to go down along with it. And a lot of these stocks are going to crash because they’re not going to have any real revenue because their customers are going to be broke and they’re not going to be able to sell these higher-cost products because inflation will drive up the cost of producing all these products that their consumers really can’t afford to buy.”
Which was followed by this bon mot:
The fact that we weren’t prepared at all, that’s the problem no one wants to talk about. Why is it that Americans are loaded up with debt and living paycheck to paycheck? Why is the same thing true for so many businesses? Why are the credit losses now going to be horrific? … Because the Federal Reserve kept interest rates so low for so long that people and companies were able to borrow far more money than they ever would have been able to borrow during a normal lending environment. So, it’s because of the Federal Reserve that the society, the country, is so levered up. That’s why we’re so vulnerable. That’s why everybody needs so much help. Because the government crippled everybody with its monetary policies, and also the fiscal policies, and so now, of course, we can’t walk, so we need more government crutches so we can limp around without realizing that all that is doing is exacerbating the problems that already exist. I mean, we’ve got to fess up to reality and stop trying to sober up by drinking more alcohol. But it is a very sobering understanding to have to do that – for reality to be dealt with and stop pretending there’s a government cure for what ails us.
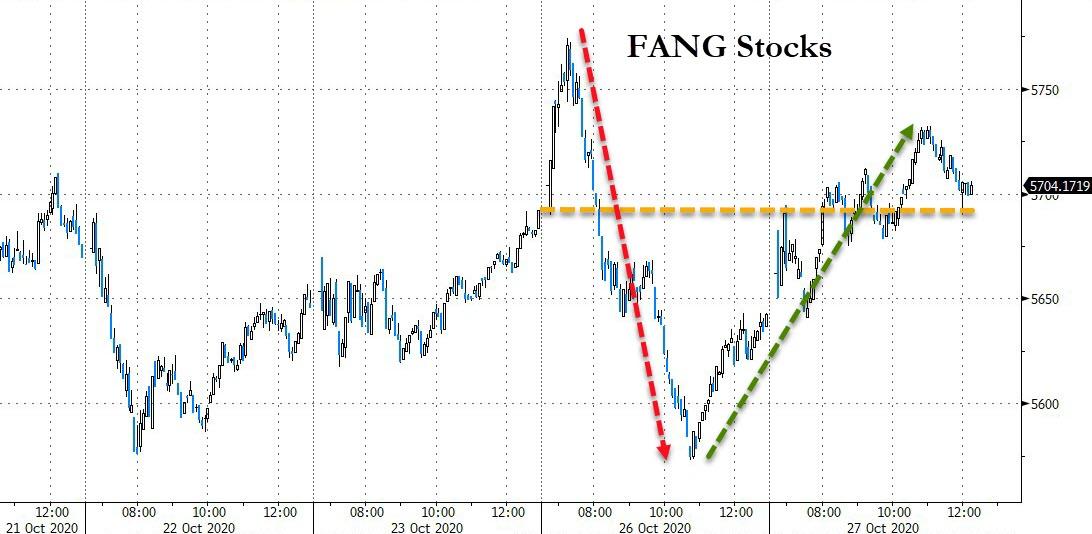
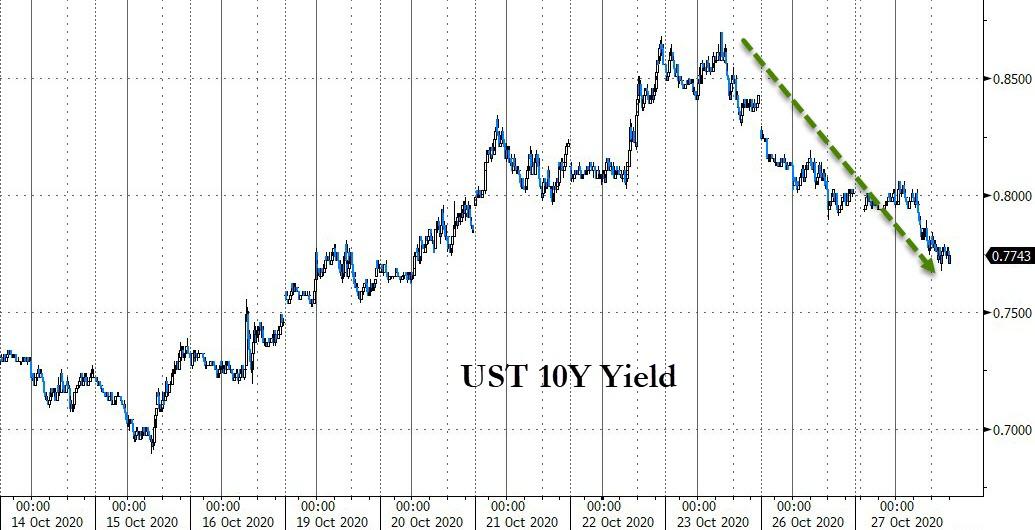
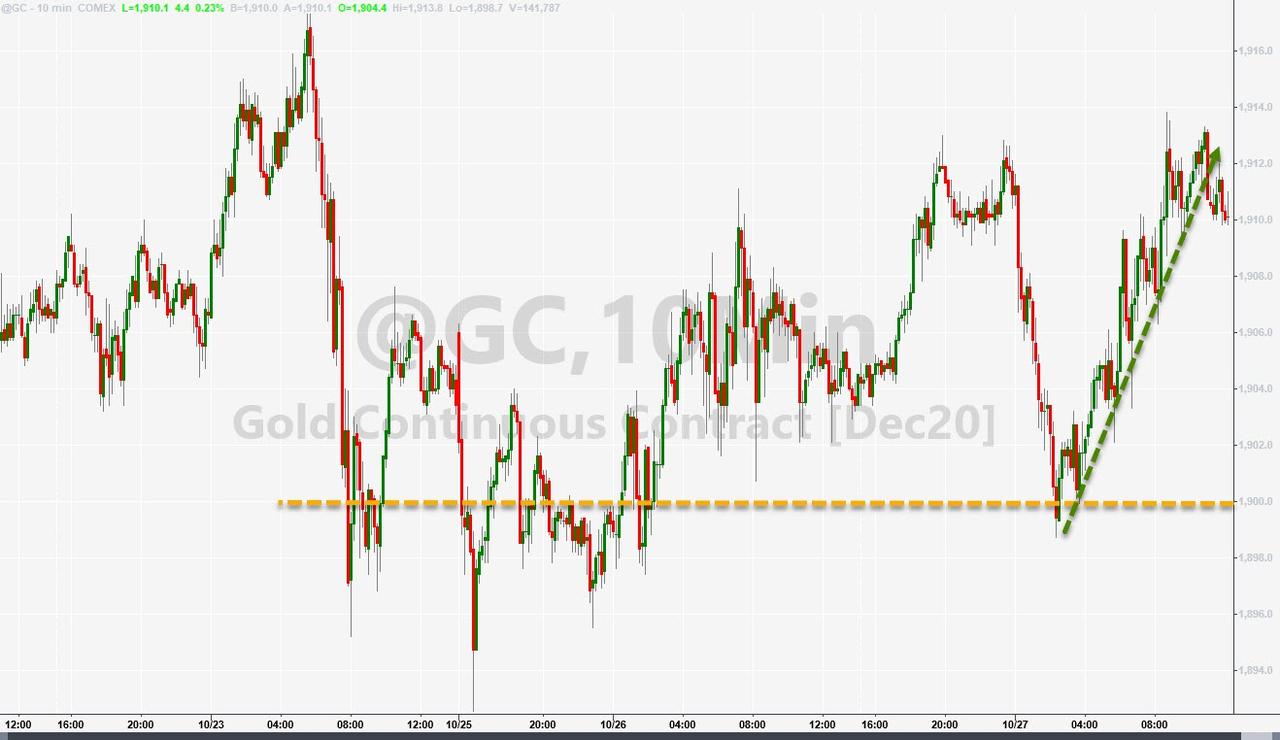
In the end, FANG stocks recovered from yesterday’s drubbing, bond yields tumbled again, the dollar slid, and gold managed to rally with the $1,900 level providing support.
I expect this aimless trading to continue for the rest of the week, possibly with a negative bias, as uncertainty will remain with us until after the elections—or even way thereafter.
2. ETFs in the Spotlight
In case you missed the announcement and description of this section, you can read it here again.
It features some of the 10 broadly diversified domestic and sector ETFs from my HighVolume list as posted every Saturday. Furthermore, they are screened for the lowest MaxDD% number meaning they have been showing better resistance to temporary sell offs than all others over the past year.
The below table simply demonstrates the magnitude with which these ETFs are fluctuating above or below their respective individual trend lines (%+/-M/A). A break below, represented by a negative number, shows weakness, while a break above, represented by a positive percentage, shows strength.
For hundreds of ETF choices, be sure to reference Thursday’s StatSheet.
For this current domestic “Buy” cycle, here’s how some our candidates have fared:

Click image to enlarge
Again, the %+/-M/A column above shows the position of the various ETFs in relation to their respective long-term trend lines, while the trailing sell stops are being tracked in the “Off High” column. The “Action” column will signal a “Sell” once the -8% point has been taken out in the “Off High” column. For more volatile sector ETFs, the trigger point is -10%.
3. Trend Tracking Indexes (TTIs)
Our TTIs took another dive, despite the major indexes pulling back only modestly.
This is how we closed 10/27/2020:
Domestic TTI: +7.71% above its M/A (prior close +9.02%)—Buy signal effective 07/22/2020
International TTI: +4.31% above its M/A (prior close +5.48%)—Buy signal effective 07/22/2020
Disclosure: I am obliged to inform you that I, as well as my advisory clients, own some of the ETFs listed in the above table. Furthermore, they do not represent a specific investment recommendation for you, they merely show which ETFs from the universe I track are falling within the specified guidelines.
Contact Ulli