- Moving the Markets
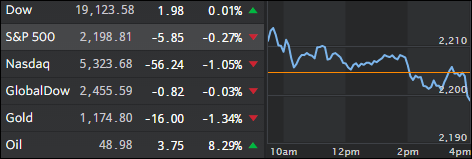
Thanks to the Trump post-election rally, the month of November ended up being a positive one, an amazing feat when considering that on election night the futures were way down with the Dow at point being in the negative by almost 900 points.
Today, all the glory went to the energy complex (+4.8%) propelled by oil prices which rocketed higher by over 8% and within striking distance of the $50/bbl milestone. The cause of this rally was an alleged OPEC agreement curtailing production. Sure, we’ve seen this movie many times before, so it remains to be seen if this is a deal that is truly nailed down. I have my doubts.
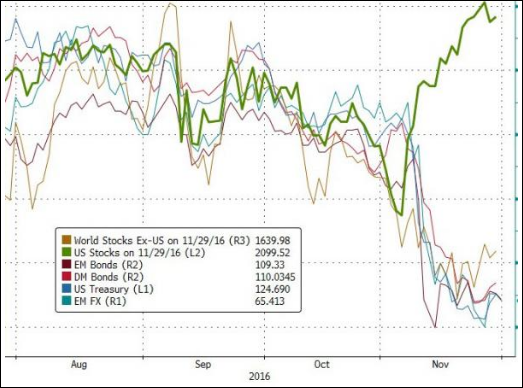
While November was quite a month for the indexes, it’s interesting to note, that widely diversified portfolios with international exposure were left in the dust as the Trump rally was concentrated primarily in domestic equities. ZH posted this spot-on chart:

As you can see, the green line (US stocks) was in total disconnect with the rest of the world something that we don’t see very often and which may not be sustainable.
With the Dow being the performance star of the month, it’s also important to note that 50% of its gains came from only 5 stocks (GS, UNH, CAT, JPM, IBM) with GS taking the lion’s share of 28% of that 1,000 point rally. Something to think about.
- ETFs in the Spotlight
In case you missed the announcement and description of this section, you can read it here again.
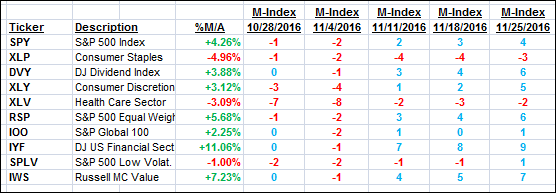
It features 10 broadly diversified ETFs from my HighVolume list as posted every Monday. Furthermore, they are screened for the lowest MaxDD% number meaning they have been showing better resistance to temporary sell offs than all others over the past year.
Here are the 10 candidates:

The above table simply demonstrates the magnitude with which some of the ETFs are fluctuating in regards to their positions above or below their respective individual trend lines (%M/A). A break below, represented by a negative number, shows weakness, while a break above, represented by a positive percentage, shows strength.
For hundreds of ETF choices, be sure to reference Thursday’s StatSheet.
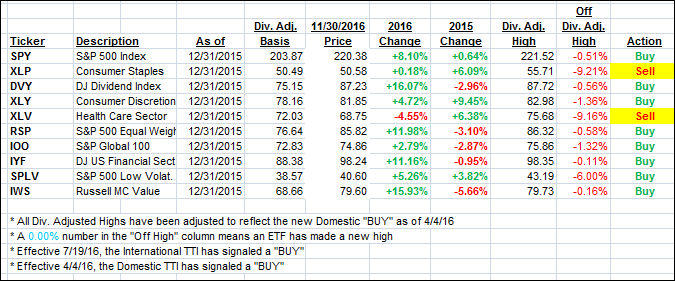
Year to date, here’s how the above candidates have fared so far:

Again, the first table above shows the position of the various ETFs in relation to their respective long term trend lines (%M/A), while the second one tracks their trailing sell stops in the “Off High” column. The “Action” column will signal a “Sell” once the -7.5% point has been taken out in the “Off High” column.
- Trend Tracking Indexes (TTIs)
Our Trend Tracking Indexes (TTIs) retreated as the major indexes closed weaker for the day. It’s important to note that our Domestic TTI has not rallied in its usual fashion, a sign that rising bond yields have generated some headwind, which will play a much bigger (negative) role in regards to equity prices should yields continue to ratchet higher.
Here’s how we closed 11/30/2016:
Domestic TTI: +0.68% (last close +1.00%)—Buy signal effective 4/4/2016
International TTI: +1.74% (last close +1.85%)—Buy signal effective 7/19/2016
Disclosure: I am obliged to inform you that I, as well as my advisory clients, own some of the ETFs listed in the above table. Furthermore, they do not represent a specific investment recommendation for you, they merely show which ETFs from the universe I track are falling within the guidelines specified.
Contact Ulli