
ETF Tracker StatSheet
You can view the latest version here.
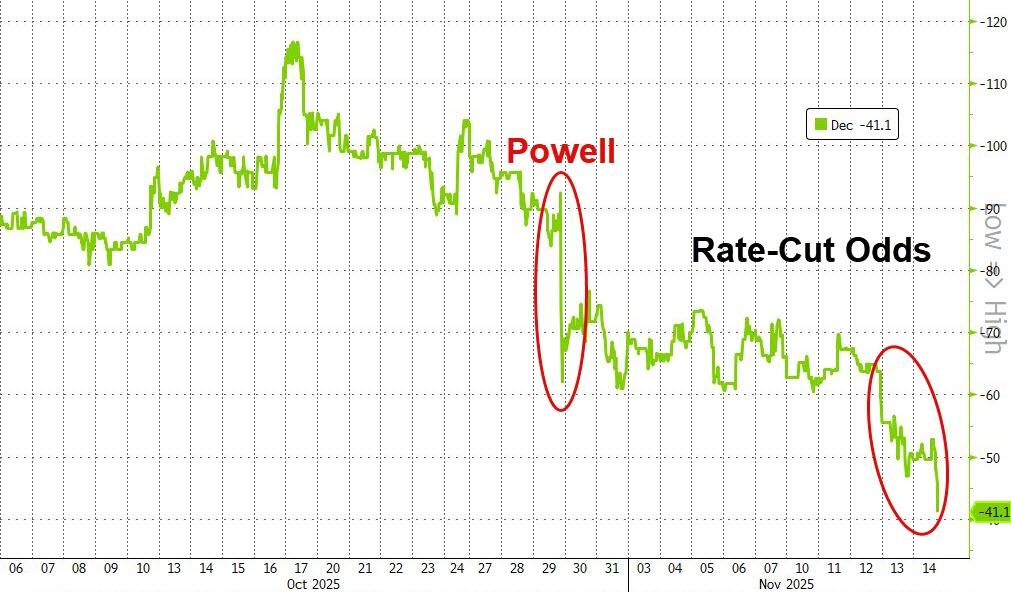
WALL STREET STUMBLES AFTER FED RATE CUT ODDS PLUNGE

- Moving the market
U.S. stocks slid again right after the opening bell, capping off a tough couple of days and notching their worst single day drop since early October.
The Dow erased nearly 800 points, undoing Wednesday’s gains and the recent milestone push above 48,000, while the Nasdaq fell more than 2%, putting its impressive seven-week winning streak at risk as technology giants took heavy losses.
Wall Street’s anxiety was stoked by valuation concerns in artificial intelligence stocks (with Oracle in particular rattling investors), plus rising debt levels and massive spending for future AI infrastructure.
On top of this, doubts are mounting about the likelihood of a Federal Reserve rate cut in December—rate cut odds have plunged from over 95% to just above 51% in recent weeks, leaving traders on edge about the path forward.
The end of the government shutdown was expected to bring clarity, but instead there’s worry some economic data may never be released.
Technical support helped slow the decline, with the S&P 500 and Mag 7 basket bouncing back slightly but still ending the week flat.
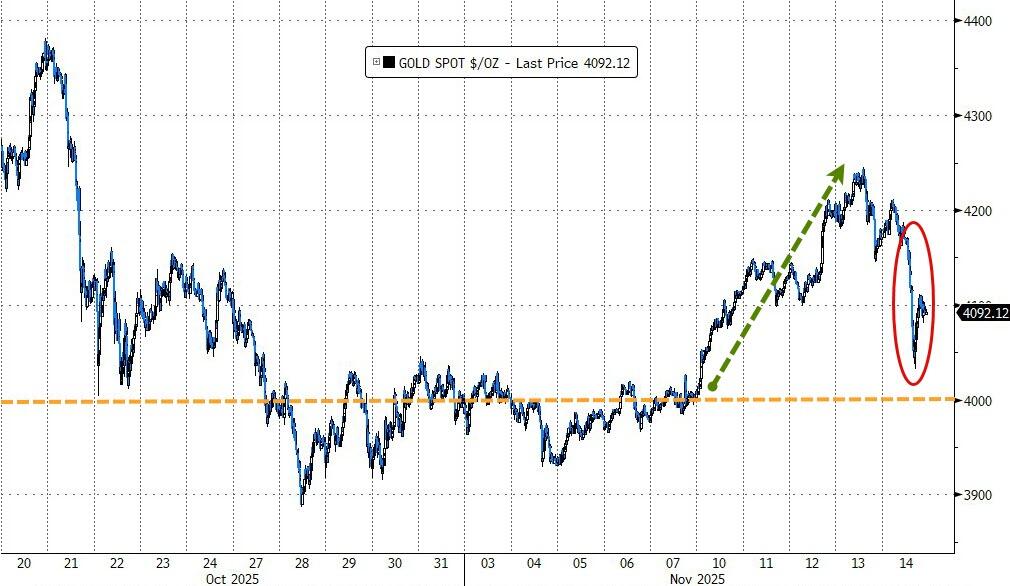
Outside equities, gold managed to rebound 2% for the week and break its losing streak, while silver outperformed despite late-week selling.
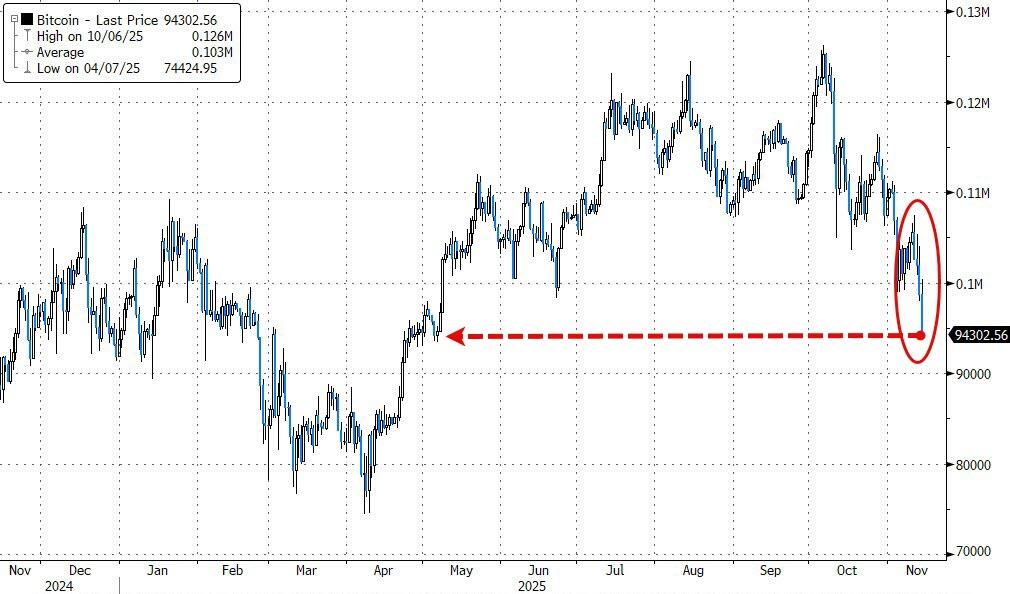
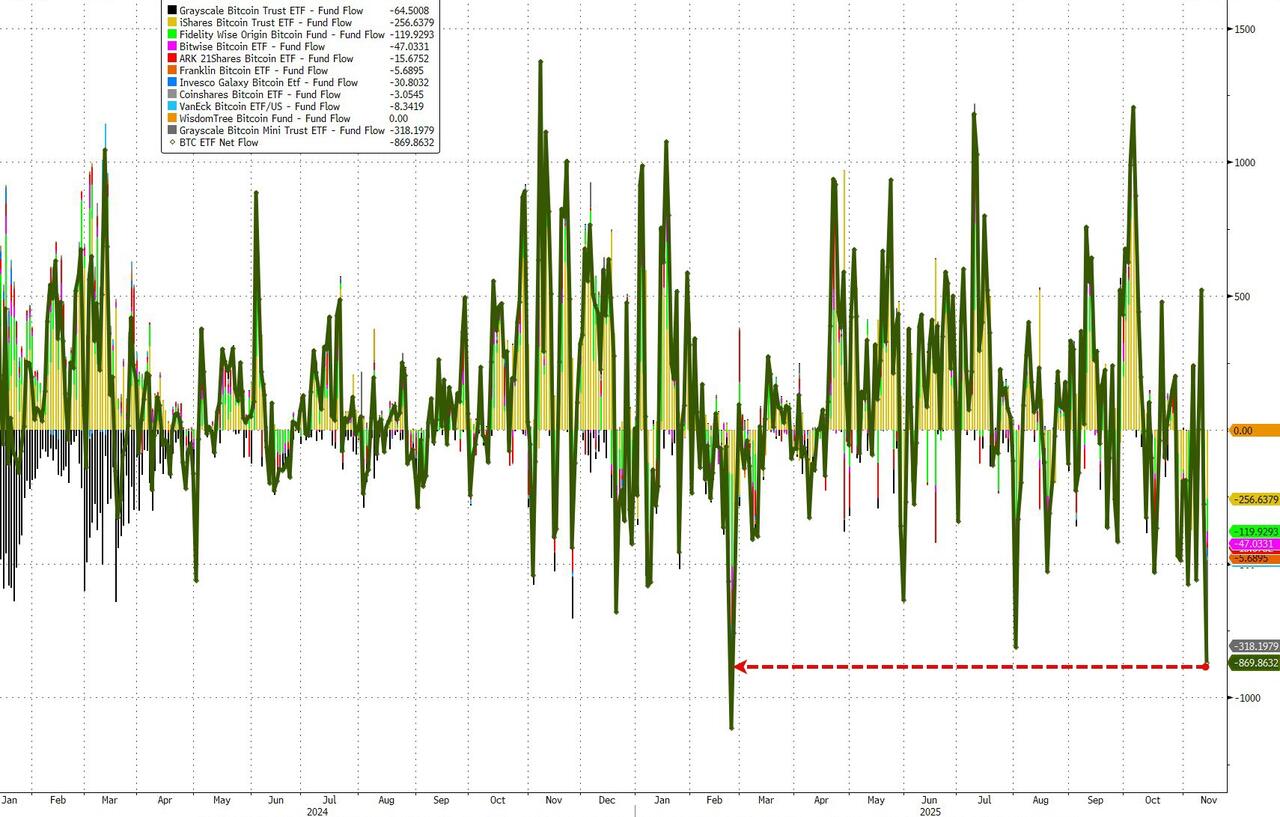
Bitcoin fell to $94k—its lowest in six months—as outflows from bitcoin ETFs accelerated and the coin separated from its usual correlation with the Nasdaq.
Will next week’s sessions offer more clarity, or is uncertainty going to be the market’s constant companion as we approach year-end?
2. Current domestic “Buy” Cycle (effective 5/20/2025); International “Buy” Cycle (effective 5/8/25)
Our domestic bullish cycle that began on November 21, 2023, concluded on April 3, 2025, following a market downturn triggered by President Trump’s tariff policy announcement.
This development caused significant declines across major indexes and broader market indices. However, markets subsequently rebounded, culminating in a new domestic “Buy” signal taking effect May 20, 2025.
Concurrently, our International Trend Tracking Index (TTI) experienced parallel volatility. On April 4, 2025, it breached critical thresholds, prompting a “Sell” recommendation. This position reversed as global markets recovered, with the International TTI regaining sufficient momentum to issue a new “Buy” signal effective May 8, 2025.
3. Trend Tracking Indexes (TTIs)
The bulls and bears kept up their tug of war today, with markets opening on a weak note and most major indexes never really recovering.
Only the S&P 500 was able to barely close in the green, eking out just enough strength to finish the week unchanged, while others like the Dow and Nasdaq remained stuck in the red.
Fresh uncertainty dominated as traders weighed patchy economic data and the Fed’s next move, leaving sentiment mixed as the session wore on.
Our TTIs echoed the caution, both ending the week lower as defensive posturing continued.
This is how we closed 11/14/2025:
Domestic TTI: +4.45% above its M/A (prior close +4.93%)—Buy signal effective 5/20/25.
International TTI: +9.91% above its M/A (prior close +11.07%)—Buy signal effective 5/8/25.
All linked charts above are courtesy of Bloomberg via ZeroHedge.
———————————————————-
WOULD YOU LIKE TO HAVE YOUR INVESTMENTS PROFESSIONALLY MANAGED?
Do you have the time to follow our investment plans yourself? If you are a busy professional who would like to have his portfolio managed using our methodology, please contact me directly to get more details.
Contact Ulli