
- Moving the market
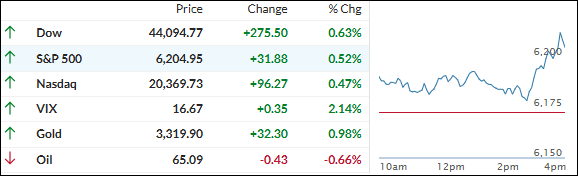
Stocks kicked off the last day of June on a positive note, riding the wave of last week’s bullish momentum.
That upward push got an extra boost when Canada backed off its digital services tax to smooth over trade talks with the U.S.—a quick reversal after President Trump abruptly ended discussions just three days earlier. So, that mini trade war? It lasted all of 72 hours.
Investors are still waiting to see if any real trade deals materialize before the July 9 deadline, when Trump’s 90-day tariff pause runs out. Secretary Bessent hinted that while some countries are negotiating “in good faith,” the U.S. won’t hesitate to snap back to earlier tariff levels if talks stall. No pressure, right?
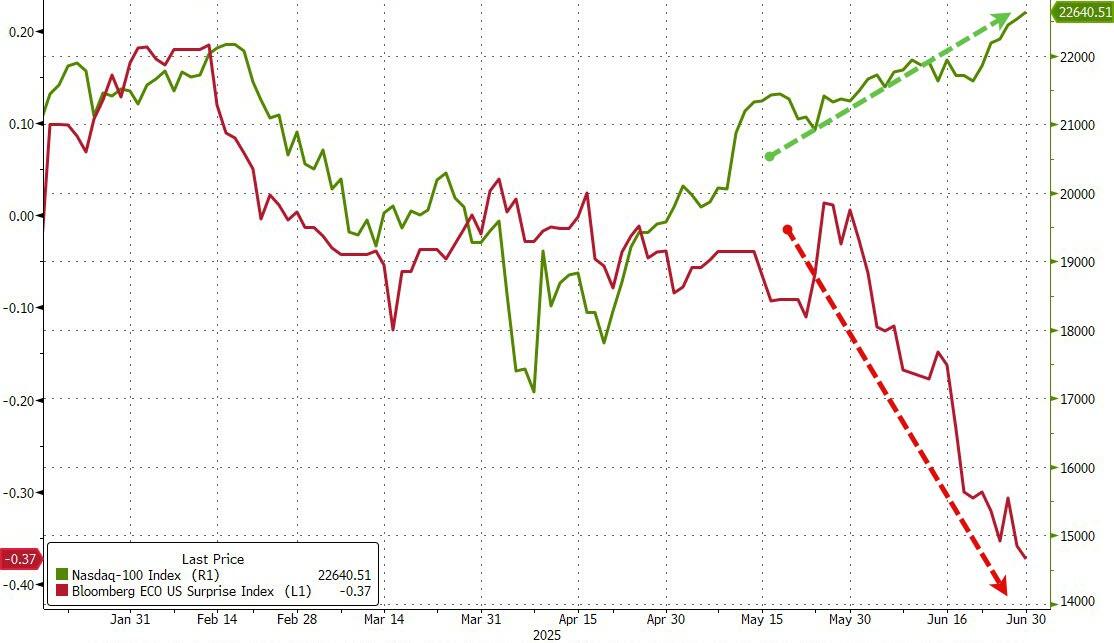
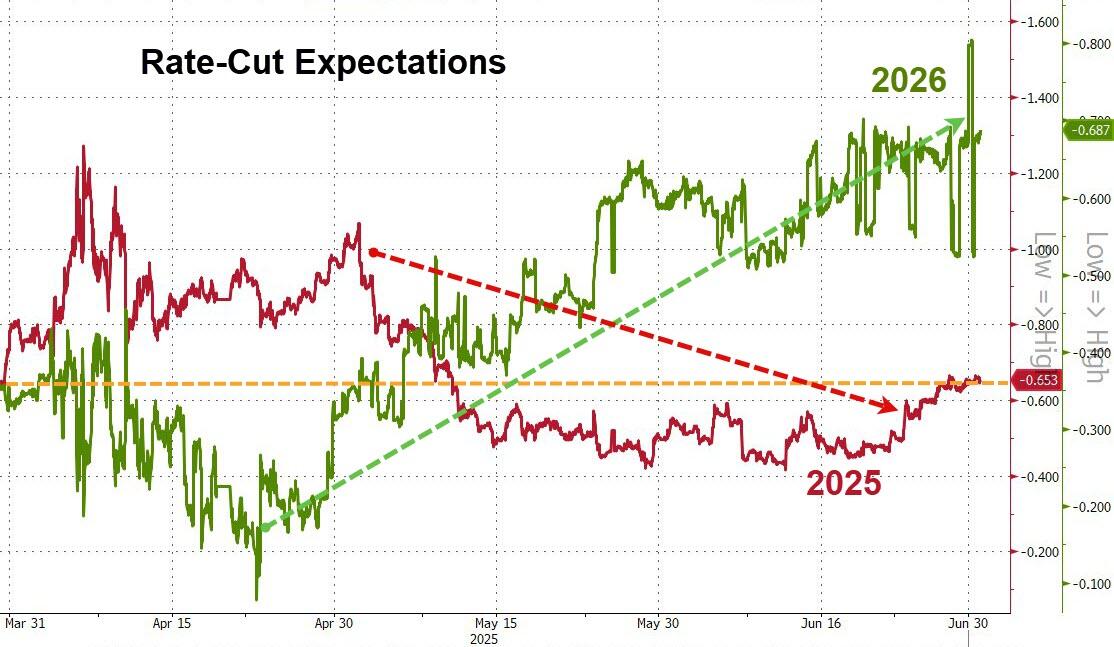
Overall, June turned into a recovery month. Stocks, bonds, Bitcoin, and crude oil all moved higher, while the dollar and U.S. macro data slipped—ironically, that weaker data helped fuel hopes for rate cuts, which gave stocks another lift.
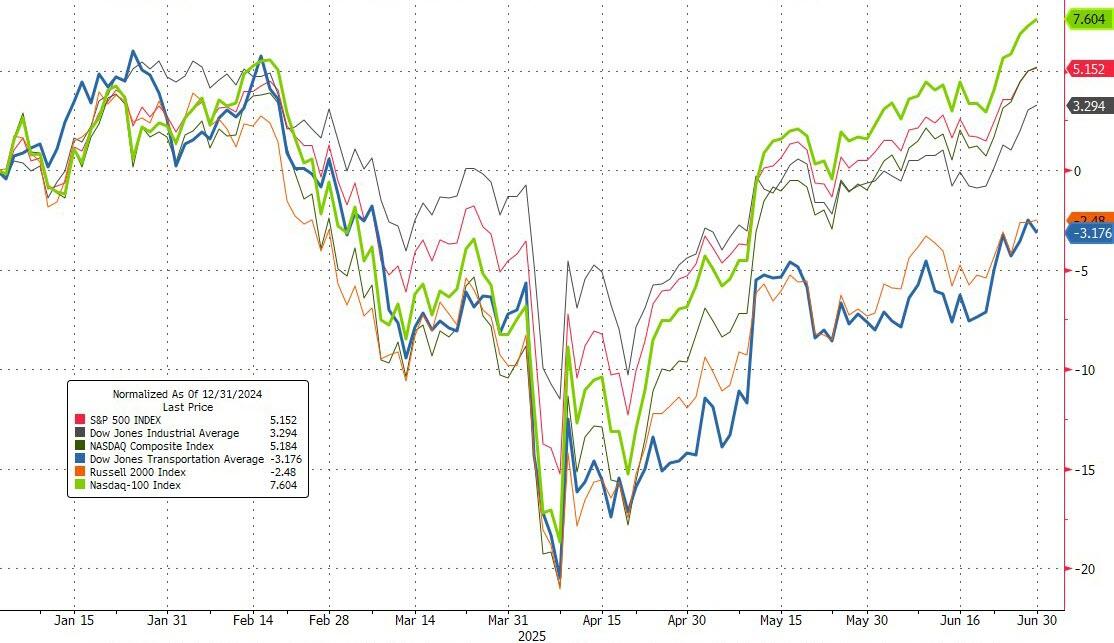
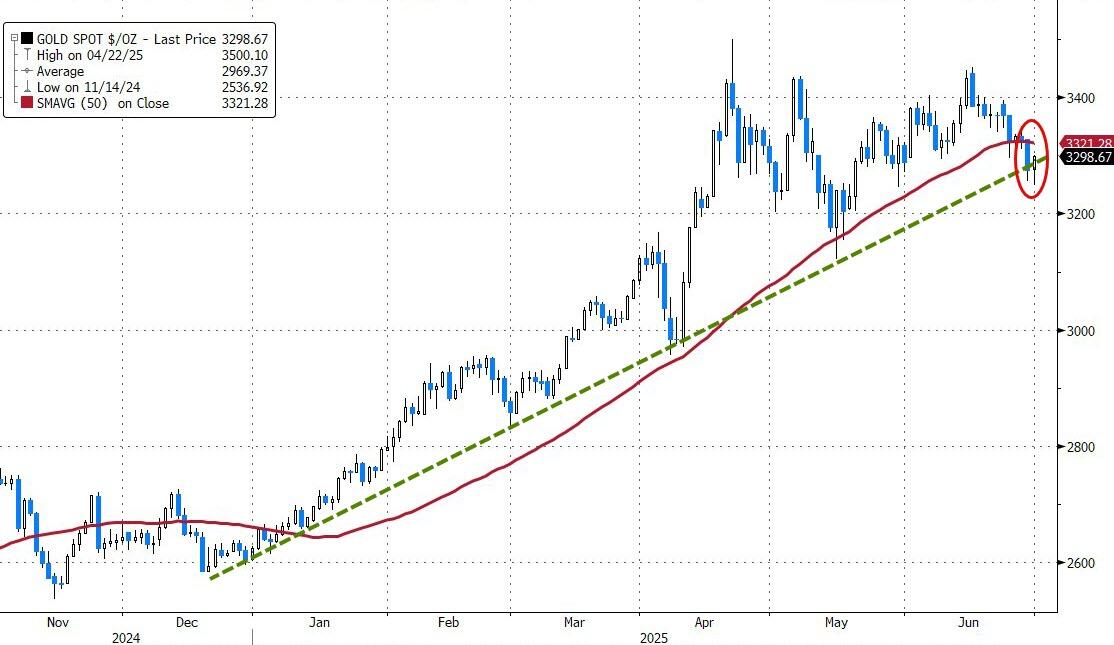
For the year so far, the Nasdaq leads the pack with a +7.6% gain, followed by the S&P 500. Small Caps and Transport stocks didn’t fare as well. But gold? It’s still the top performer, outshining all major equity indexes by a wide margin (+25.9%)
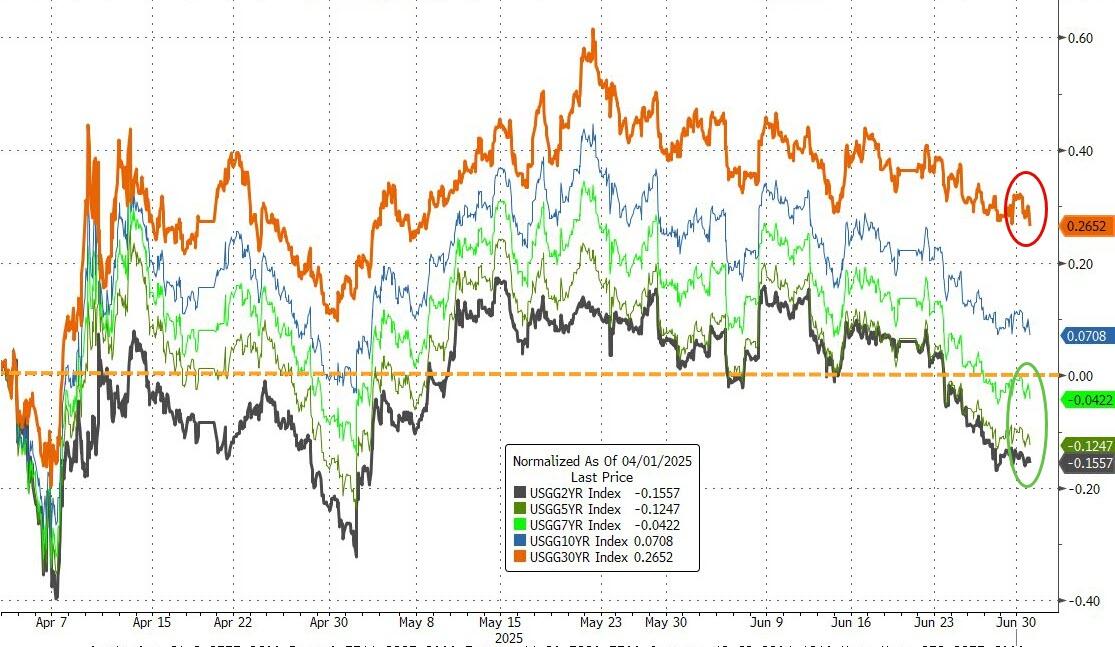
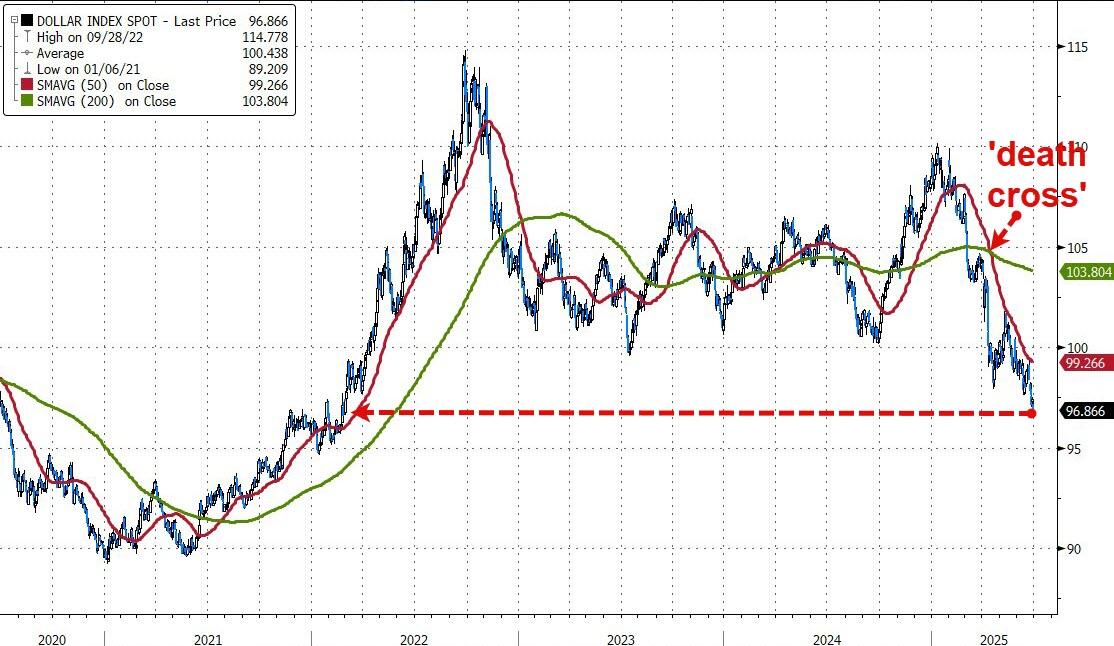
Bond yields wrapped up the quarter mixed, and the dollar just had its worst quarter since late 2022. Gold, after a strong start to the year, has been treading water for the past two months.
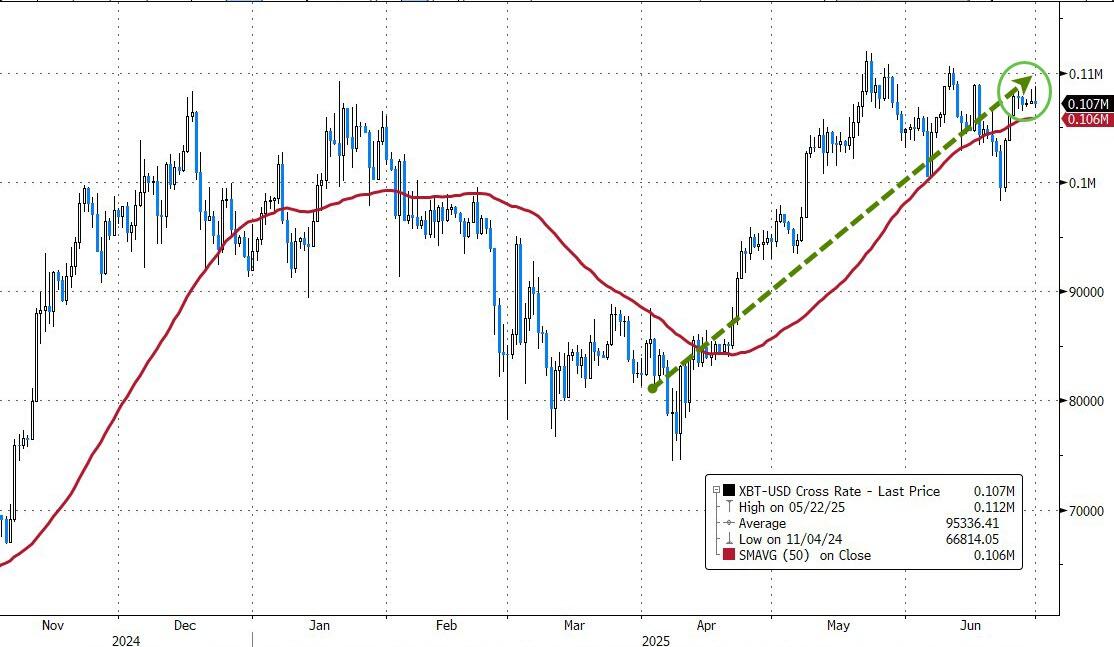
Meanwhile, Bitcoin had a stellar quarter, rising every month—even if June’s gains were more modest, it still notched a record monthly close.
So, with June in the books and momentum still alive… will the bulls keep charging, or are the bears just catching their breath?
2. Current domestic “Buy” Cycle (effective 5/20/2025); International “Buy” Cycle (effective 5/8/25)
Our domestic bullish cycle that began on November 21, 2023, concluded on April 3, 2025, following a market downturn triggered by President Trump’s tariff policy announcement.
This development caused significant declines across major indexes and broader market indices. However, markets subsequently rebounded, culminating in a new domestic “Buy” signal taking effect May 20, 2025.
Concurrently, our International Trend Tracking Index (TTI) experienced parallel volatility. On April 4, 2025, it breached critical thresholds, prompting a “Sell” recommendation. This position reversed as global markets recovered, with the International TTI regaining sufficient momentum to issue a new “Buy” signal effective May 8, 2025.
3. Trend Tracking Indexes (TTIs)
Stocks started the day with a modest lift, but by the end of the session, buyers were out in full force.
On this final trading day of June, the major indexes rallied steadily and closed solidly in the green. Interestingly, the usual afternoon dip never showed up, giving the month a strong and upbeat finish.
Our TTIs moved right in step with the broader market, both ending the day at their highest points during this current “Buy” cycle.
This is how we closed 06/30/2025:
Domestic TTI: +3.53% above its M/A (prior close +3.05%)—Buy signal effective 5/20/25.
International TTI: +8.63% above its M/A (prior close +8.30%)—Buy signal effective 5/8/25.
All linked charts above are courtesy of Bloomberg via ZeroHedge.
———————————————————-
WOULD YOU LIKE TO HAVE YOUR INVESTMENTS PROFESSIONALLY MANAGED?
Do you have the time to follow our investment plans yourself? If you are a busy professional who would like to have his portfolio managed using our methodology, please contact me directly to get more details.
Contact Ulli