
- Moving the market
Early gains came after cooler-than-expected inflation data and news of a preliminary trade deal between the U.S. and China. The Consumer Price Index (CPI) rose just 0.1% in May—below the 0.2% forecast—and core CPI (excluding food and energy) matched that soft reading.
This suggests tariffs haven’t had a major immediate impact yet. Companies may still be working through existing inventory or hesitating to raise prices amid shaky demand.
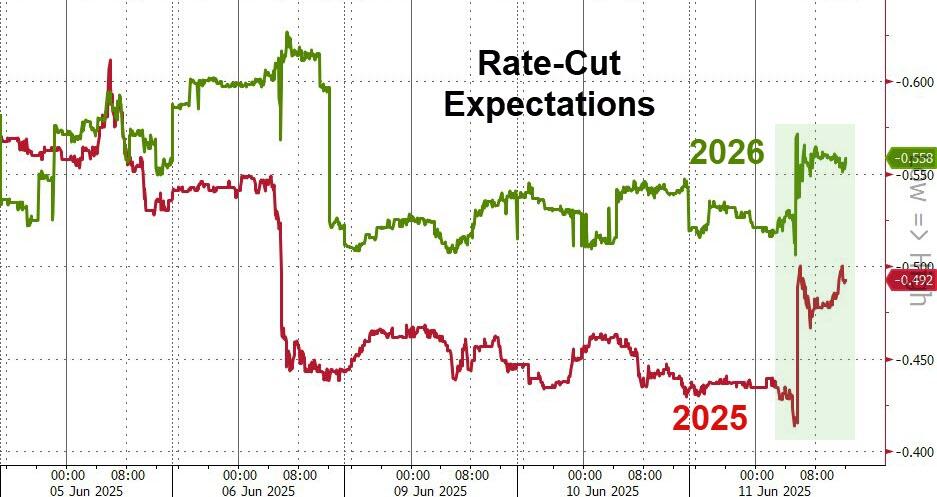
With a 90-day pause on new tariffs, traders are shifting their focus to inflation and jobs data. If inflation stays tame—or if the job market starts to weaken—hopes for a rate cut could gain traction.
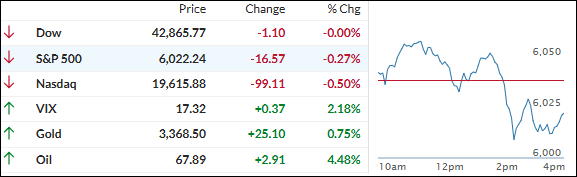
But the optimism didn’t last. Midday, markets reversed course after Treasury Secretary Bessent hinted at extending the tariff deadline, and tensions in Iraq flared up again. By the close, only the Dow managed to break even.
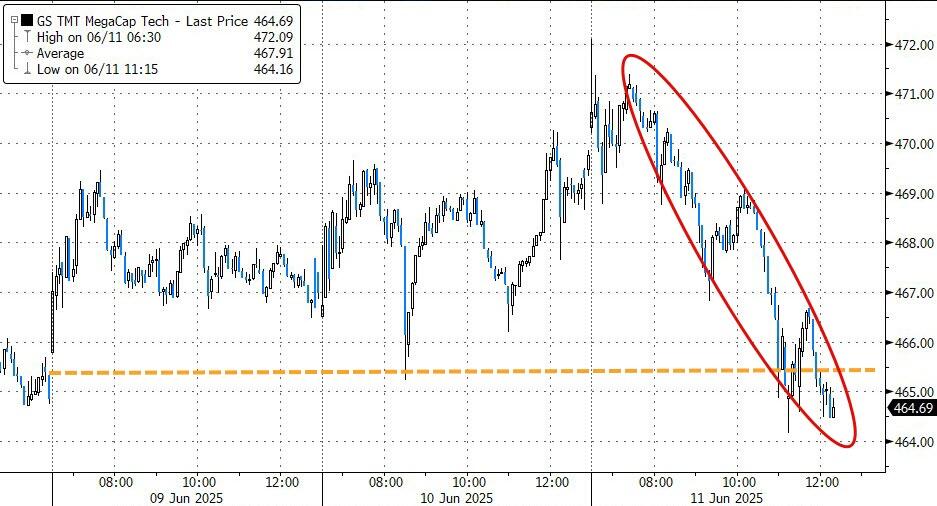
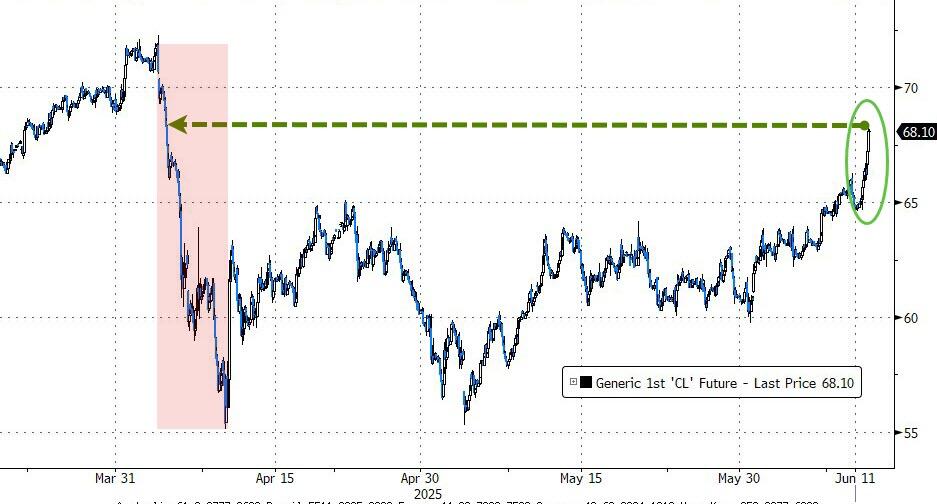
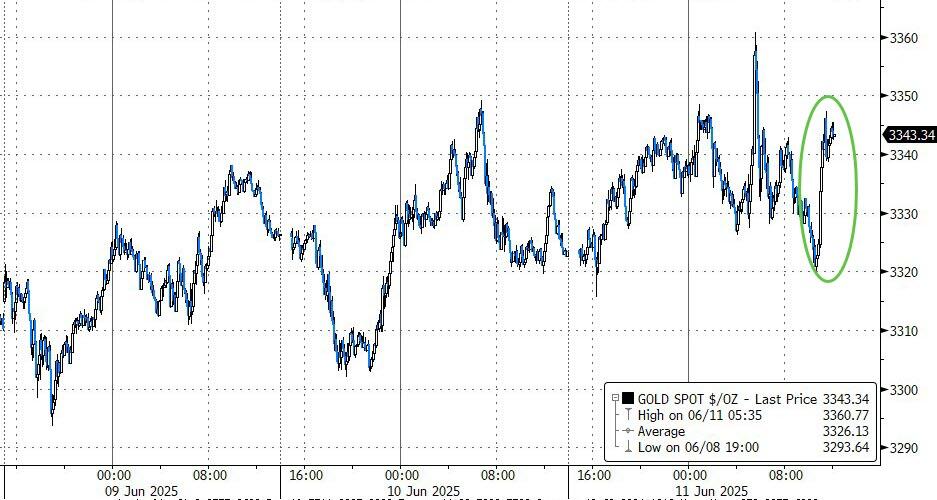
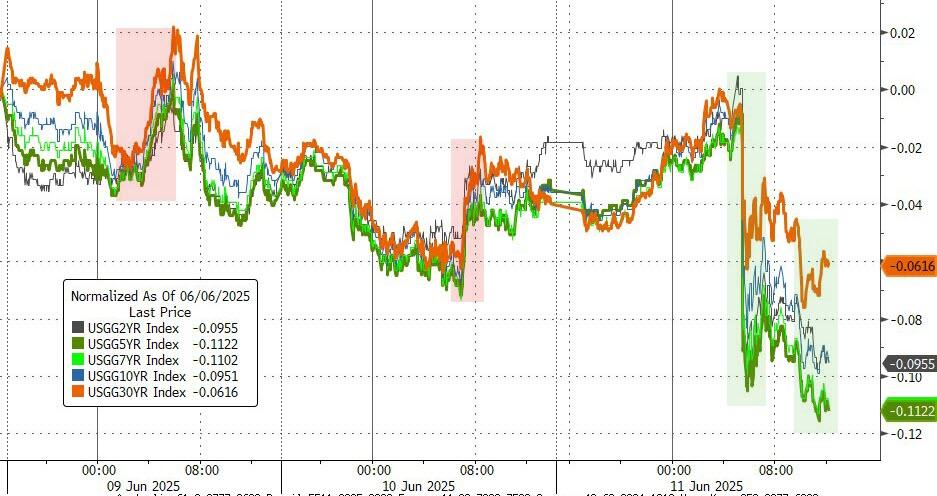
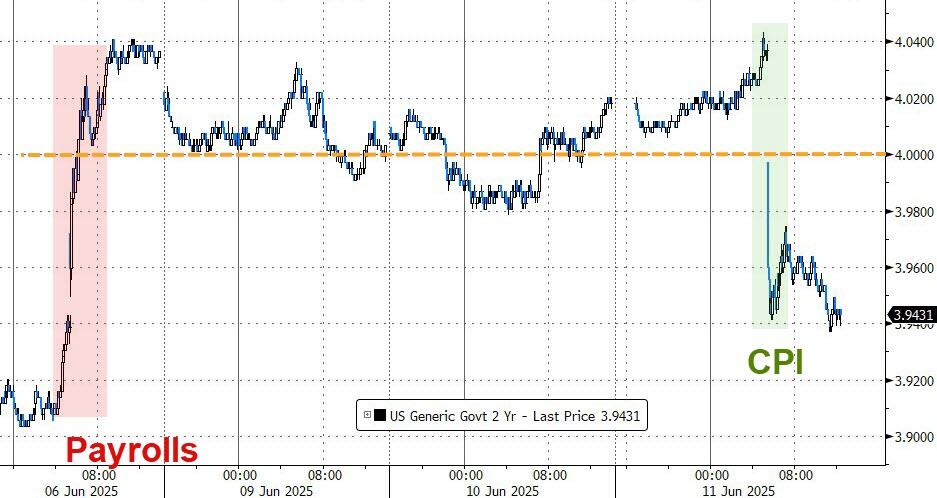
Mega-cap tech stocks slipped into the red for the week. Crude oil surged on renewed Middle East worries, gold jumped, and bond yields dropped as investors sought safety. The 2-year yield fell below 4%, boosting rate-cut expectations.
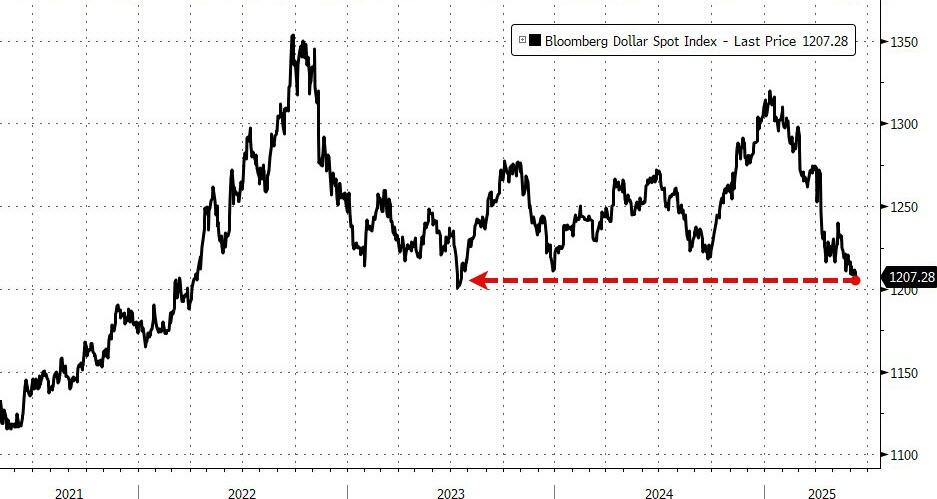
Meanwhile, the dollar took a hit, falling to its lowest level since July 2023.
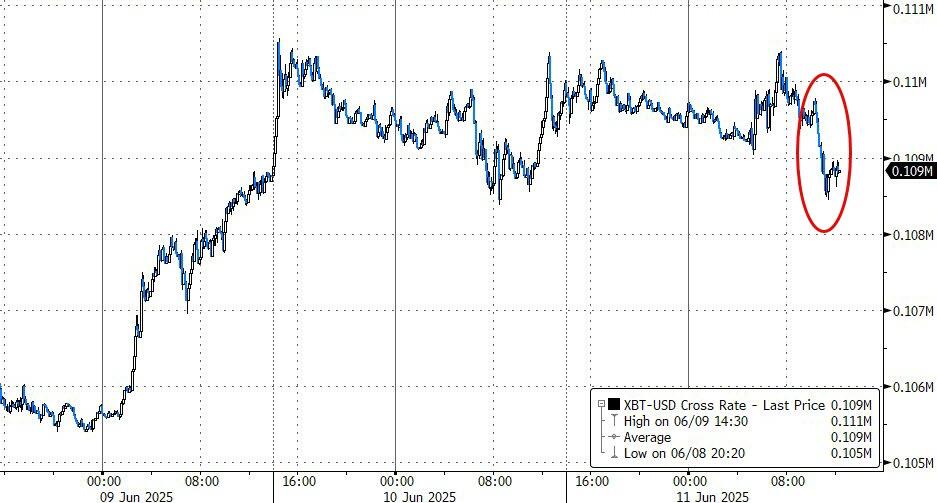
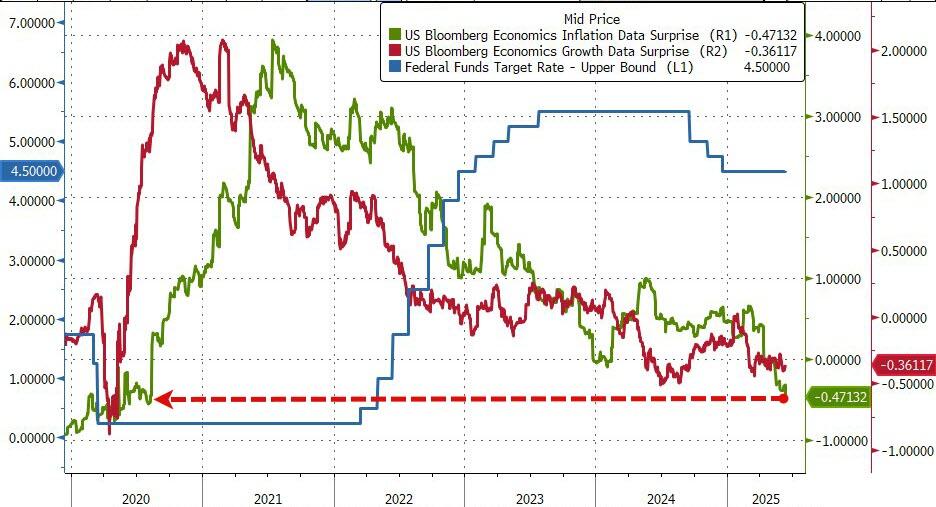
Bitcoin dipped but found support around $109K. And with the soft CPI print, the U.S. inflation surprise index hit its lowest level since August 2020.
So, with inflation cooling and markets on edge—what’s the Fed waiting for?
2. Current domestic “Buy” Cycle (effective 5/20/2025); International “Buy” Cycle (effective 5/8/25)
Our domestic bullish cycle that began on November 21, 2023, concluded on April 3, 2025, following a market downturn triggered by President Trump’s tariff policy announcement.
This development caused significant declines across major indexes and broader market indices. However, markets subsequently rebounded, culminating in a new domestic “Buy” signal taking effect May 20, 2025.
Concurrently, our International Trend Tracking Index (TTI) experienced parallel volatility. On April 4, 2025, it breached critical thresholds, prompting a “Sell” recommendation. This position reversed as global markets recovered, with the International TTI regaining sufficient momentum to issue a new “Buy” signal effective May 8, 2025.
3. Trend Tracking Indexes (TTIs)
We saw a brief bounce early on, but it didn’t last—both the S&P 500 and Nasdaq ended the day in the red. The session felt like a game of headline ping-pong, with conflicting news keeping traders on edge and adding to the uncertainty.
Our TTIs split paths: the domestic TTI slipped a bit, while the international one held up better and even managed to notch a small gain.
This is how we closed 06/11/2025:
Domestic TTI: +1.78% above its M/A (prior close +2.07%)—Buy signal effective 5/20/25.
International TTI: +7.36% above its M/A (prior close +7.12%)—Buy signal effective 5/8/25.
All linked charts above are courtesy of Bloomberg via ZeroHedge.
———————————————————-
WOULD YOU LIKE TO HAVE YOUR INVESTMENTS PROFESSIONALLY MANAGED?
Do you have the time to follow our investment plans yourself? If you are a busy professional who would like to have his portfolio managed using our methodology, please contact me directly to get more details.
Contact Ulli