
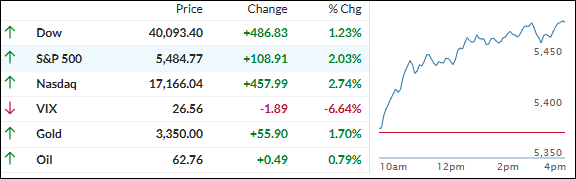
- Moving the market
The tech sector led the ongoing rebound, as traders sought signs of progress in the heated tariff situation.
Despite China’s overnight announcement that no trade talks were happening with the U.S., they confirmed that all statements about progress on bilateral talks should be dismissed and that the cancellation of unilateral tariffs is forthcoming.
Wall Street traders found Trump’s less confrontational approach toward talks with Beijing more convincing, which fueled bullish sentiment for the third consecutive day.
While the markets are hoping for a reversal of tariffs or significant trade deals, we are still in correction territory. It remains to be seen whether the current optimism will push both indexes back onto a bullish path.
Recent economic “hard” data has crushed the “recession is imminent” narrative, although “soft” data remains weak, as illustrated by this chart.
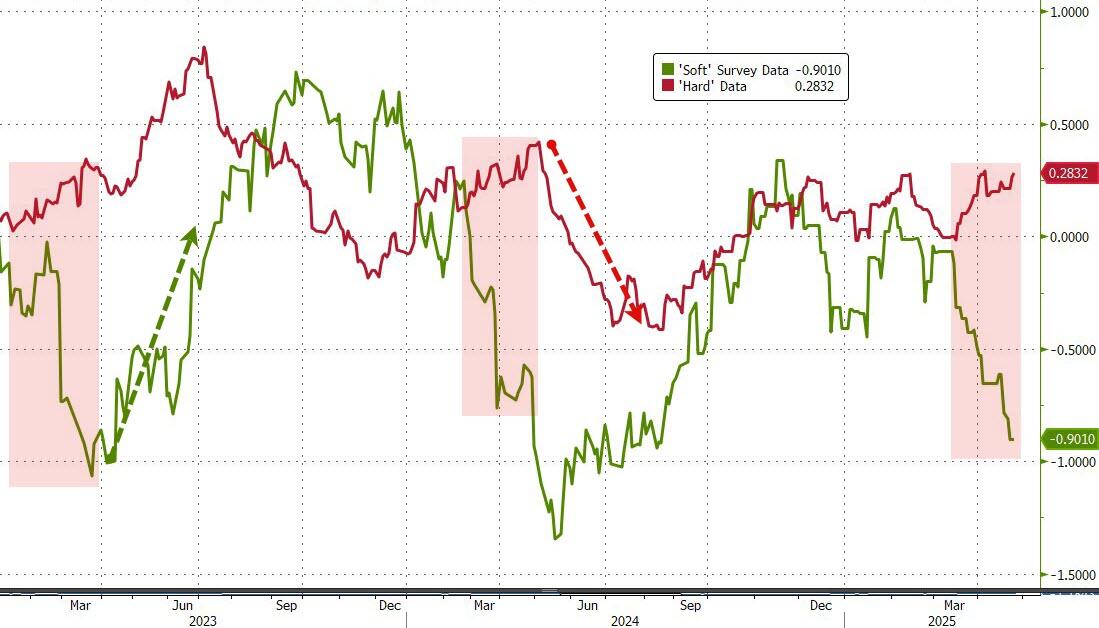
Despite the headline fluctuations, the markets advanced steadily without any significant intraday selloff.
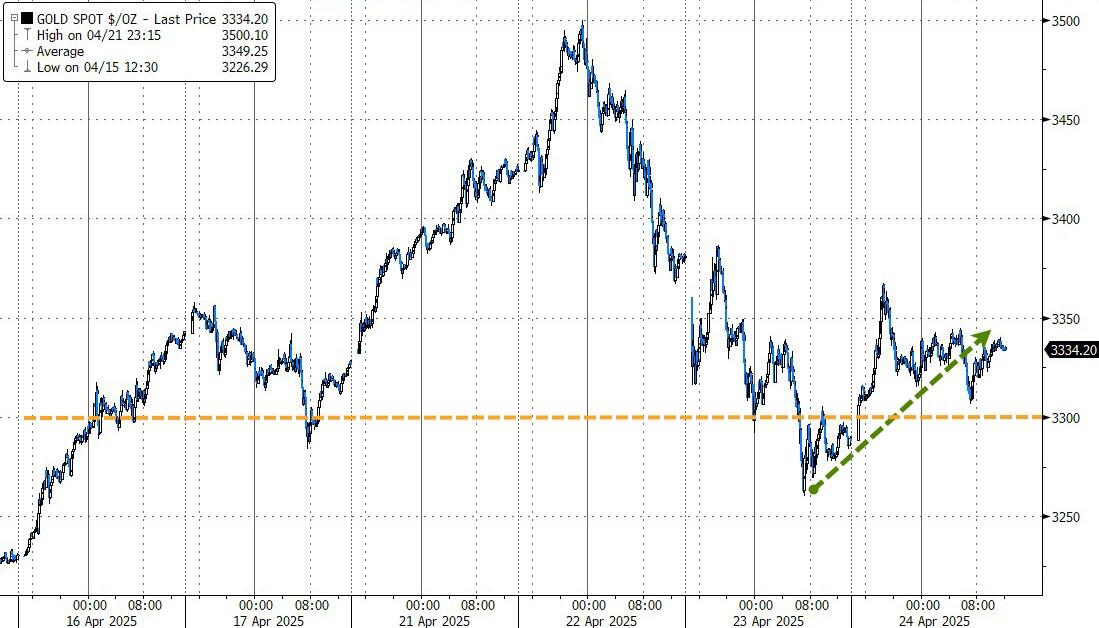
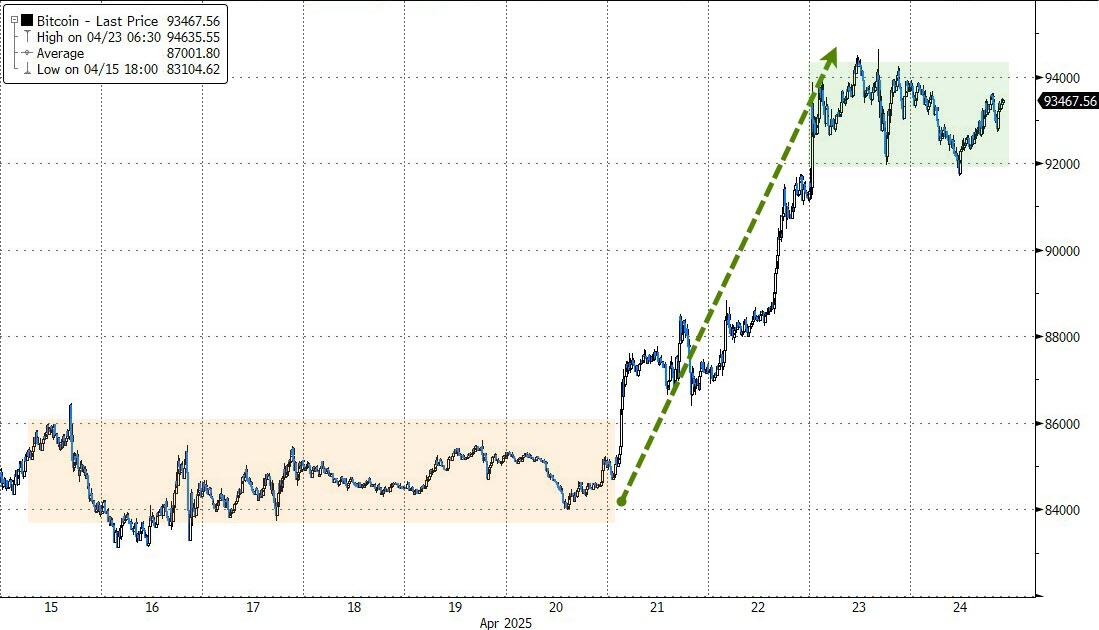
Bond yields dropped, the dollar retreated from yesterday’s highs, which helped gold rebound from its recent pullback, while Bitcoin maintained its gains.
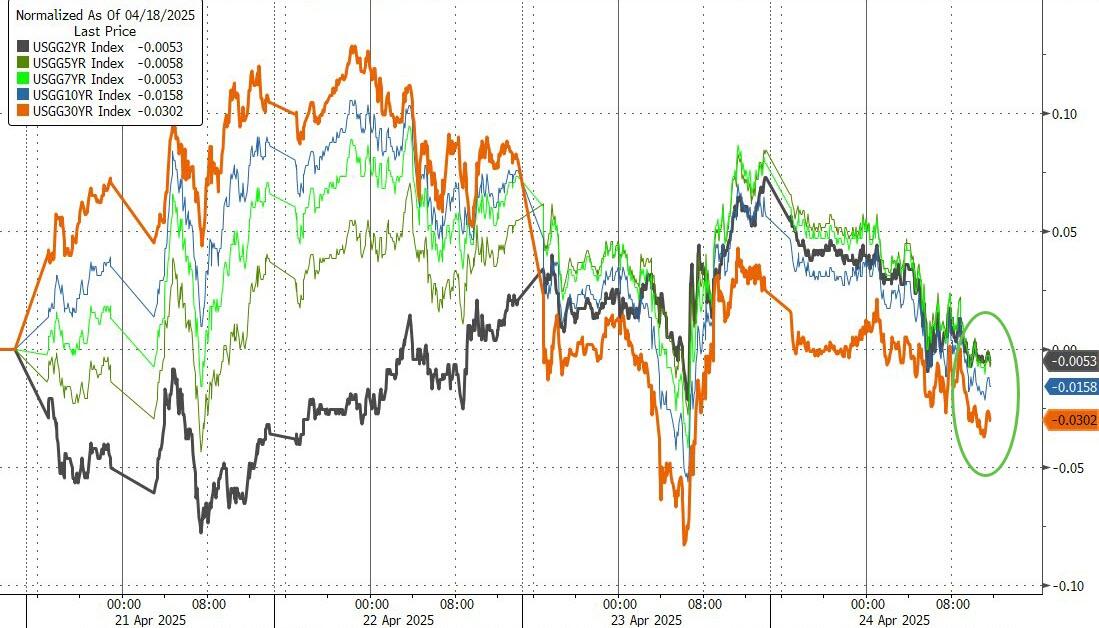
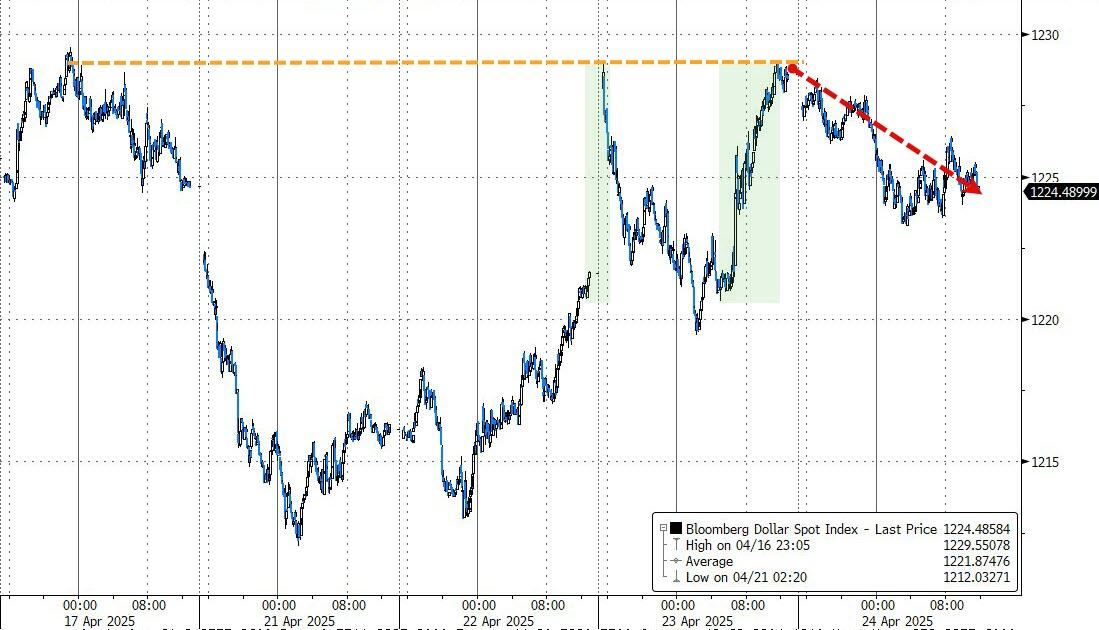
Can the markets close out this week with another win tomorrow?
2. Current “Sell” Cycle (effective 4/4/25)
Our domestic Buy cycle, which began on November 21, 2023, ended on April 3, 2025. The market reacted negatively to Trump’s tariff policy, causing major indexes and the broader market to drop sharply.
This confirmed the bearish trend that had been pushing our domestic TTI (Trend Tracking Index) below its trend line since March 10, 2025, but it wasn’t enough to end the Buy cycle until now. Consequently, we have exited the domestic market.
Meanwhile, our International TTI dropped sharply on April 4, 2025, generating a “Sell” signal. Since we did not have any exposure in international markets, we were not affected.
3. Trend Tracking Indexes (TTIs)
Regardless of the latest headline fluctuations, traders and algorithms viewed the news positively, leading to the major indexes achieving their third consecutive winning session.
Our TTIs mirrored the market’s performance. The international TTI broke above its long-term trend line, while the domestic TTI continued to hover below it.
For the “Sell” cycle to be considered over, I need to see more upward momentum in the international TTI.
This is how we closed 04/24/2025:
Domestic TTI: -4.13% below its M/A (prior close -5.72%)—Sell signal effective 4/4/25.
International TTI: +1.19% above its M/A (prior close +0.02%)—Sell signal effective 4/7/25.
All linked charts above are courtesy of Bloomberg via ZeroHedge.
———————————————————-
WOULD YOU LIKE TO HAVE YOUR INVESTMENTS PROFESSIONALLY MANAGED?
Do you have the time to follow our investment plans yourself? If you are a busy professional who would like to have his portfolio managed using our methodology, please contact me directly to get more details.
Contact Ulli