
- Moving the market
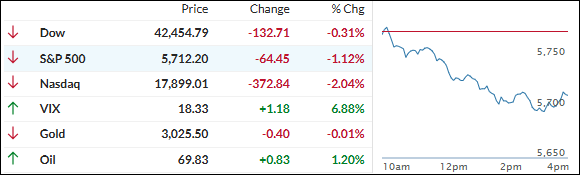
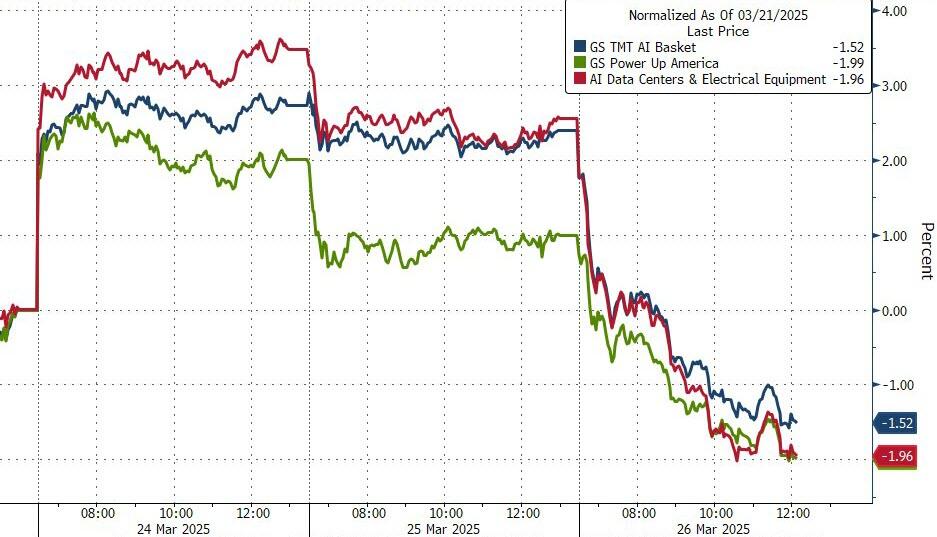
The S&P 500 and the tech sector faced early pressure and retreated as traders grappled with uncertainties surrounding tariff threats and negative news about AI and data centers.
Inflation and concerns about a potential economic slowdown, with the April 2nd tariff implementation looming, were dampening bullish sentiment.
Although Trump indicated that the tariffs might be more “lenient than reciprocal,” softening his stance from earlier reports, he still left his options open.
However, recent data points over the past week have shown that housing starts, building permits, industrial production, capacity utilization, and new home sales were all in line with or better than expectations, casting doubt on some of the negative impacts of the tariffs.
The market took another hit in afternoon trading as Trump scheduled a press conference after the close today to announce auto tariffs. While no details were available, the announcement was enough to erase any bullish sentiment, with all major indexes sinking into the red.
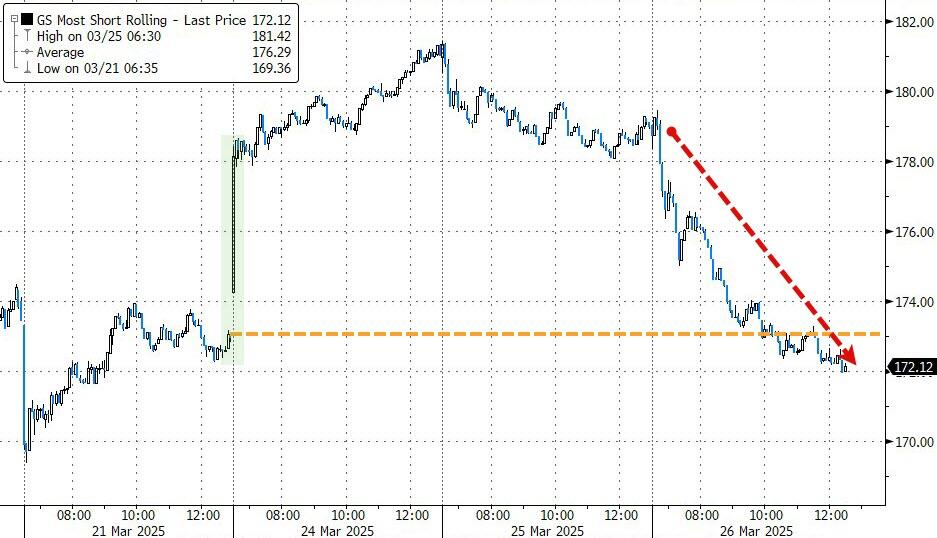
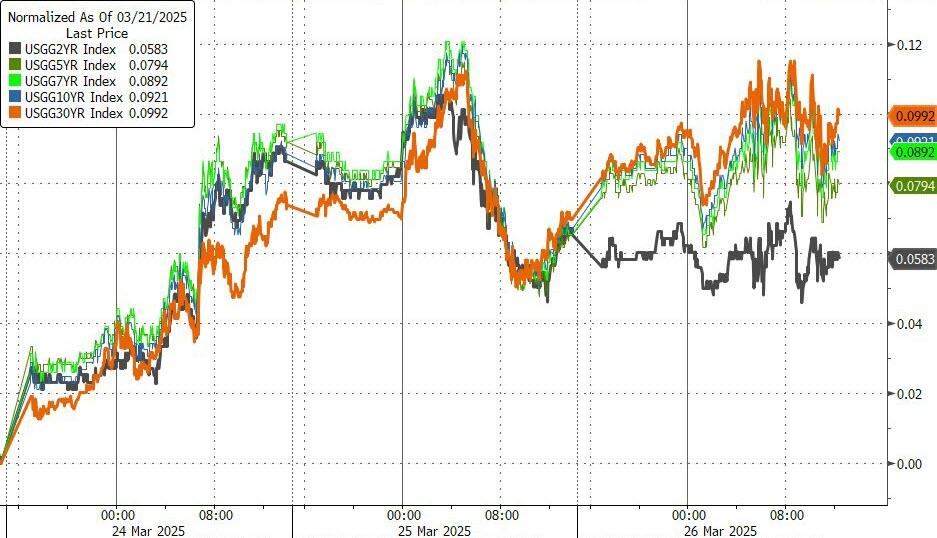
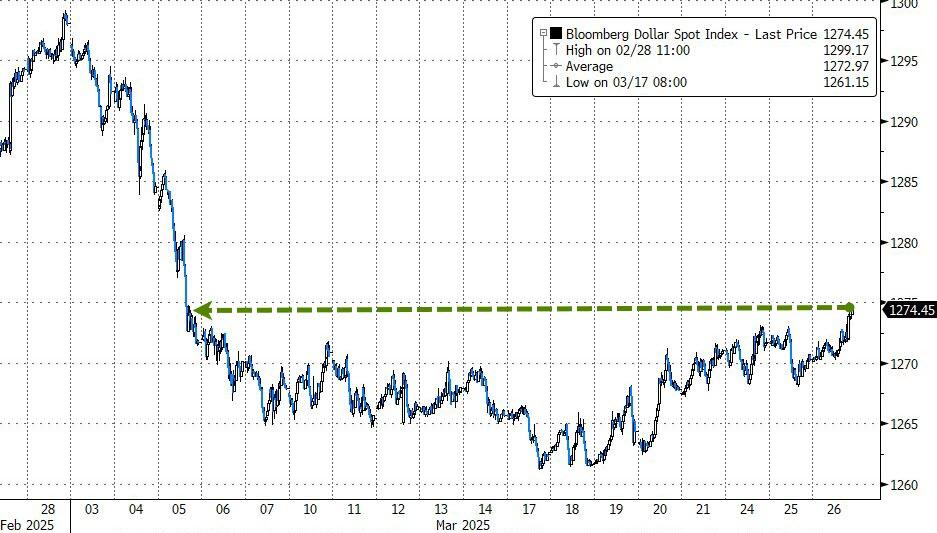
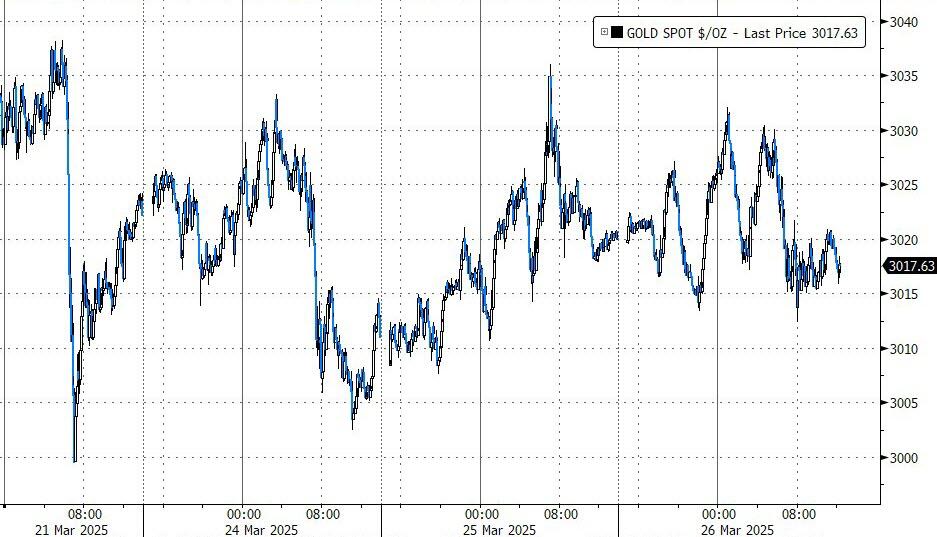
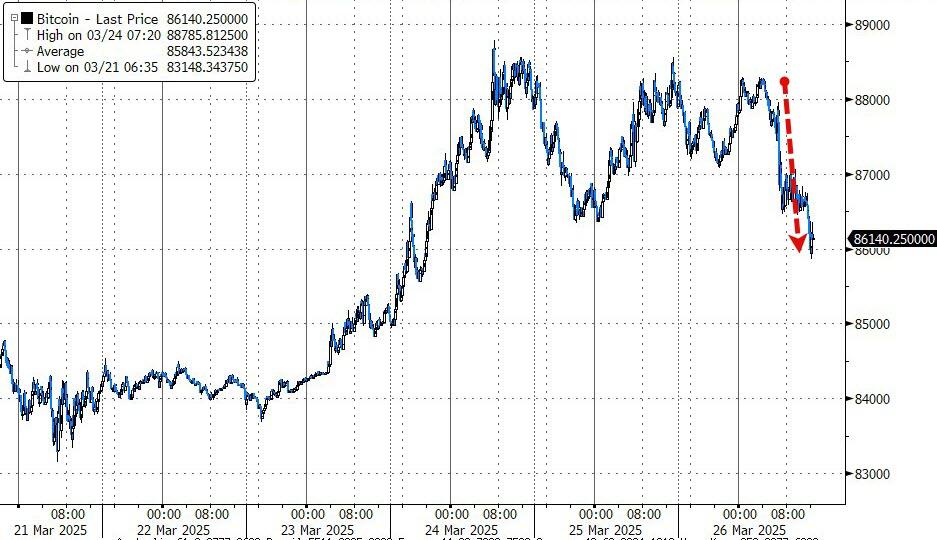
The most shorted stocks reversed and gave back this week’s advances, bond yields inched higher, as did the dollar. Gold remained unaffected, treading water, and closing unchanged. Bitcoin followed the tech sector lower but found support at the $86k level.
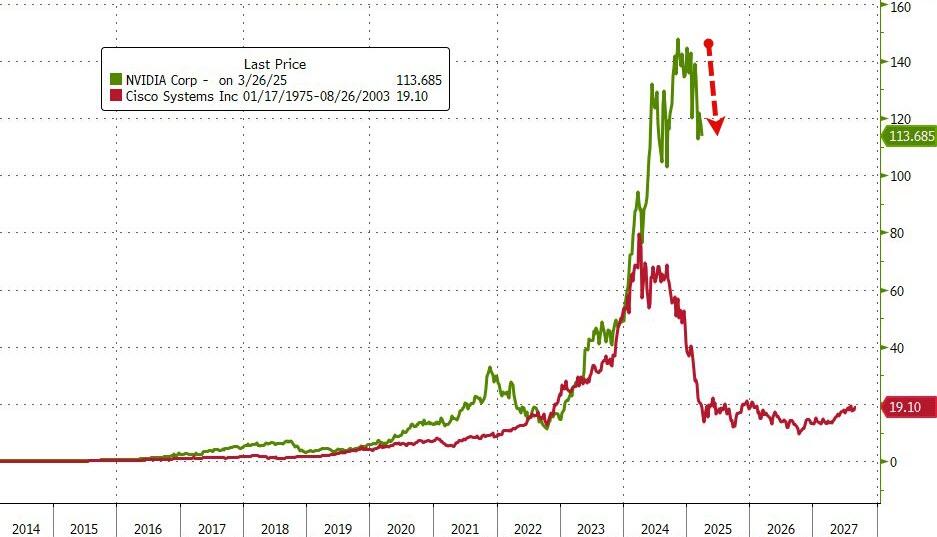
Nvidia plunged almost 6%, bringing back historical comparisons to Cisco Systems and raising the question: Will history repeat itself?
2. Current “Buy” Cycles (effective 11/21/2023)
Our Trend Tracking Indexes (TTIs) have both crossed their trend lines with enough strength to trigger new “Buy” signals. That means, Tuesday, 11/21/2023, was the official date for these signals.
If you want to follow our strategy, you should first decide how much you want to invest based on your risk tolerance (percentage of allocation). Then, you should check my Thursday StatSheet and Saturday’s “ETFs on the Cutline” report for suitable ETFs to buy.
3. Trend Tracking Indexes (TTIs)
Despite an initial rally attempt by the Dow, the major indexes ultimately declined and closed in the red, reflecting a lack of positive market direction.
Our TTIs showed little resistance against the bearish trend, pulling back moderately.
This is how we closed 03/26/2025:
Domestic TTI: -0.51% below its M/A (prior close -0.32%)—Buy signal effective 11/21/2023.
International TTI: +5.30% above its M/A (prior close +5.73%)—Buy signal effective 11/21/2023.
All linked charts above are courtesy of Bloomberg via ZeroHedge.
———————————————————-
WOULD YOU LIKE TO HAVE YOUR INVESTMENTS PROFESSIONALLY MANAGED?
Do you have the time to follow our investment plans yourself? If you are a busy professional who would like to have his portfolio managed using our methodology, please contact me directly to get more details.
Contact Ulli