
ETF Tracker StatSheet
You can view the latest version here.
TARIFF WORRIES AND INFLATION DATA DRIVE MARKETS DOWN; GOLD SHINES
- Moving the market
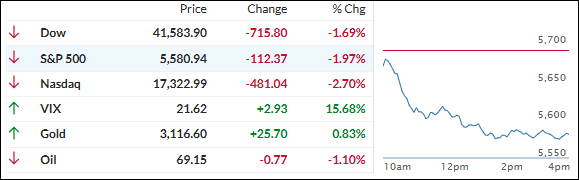
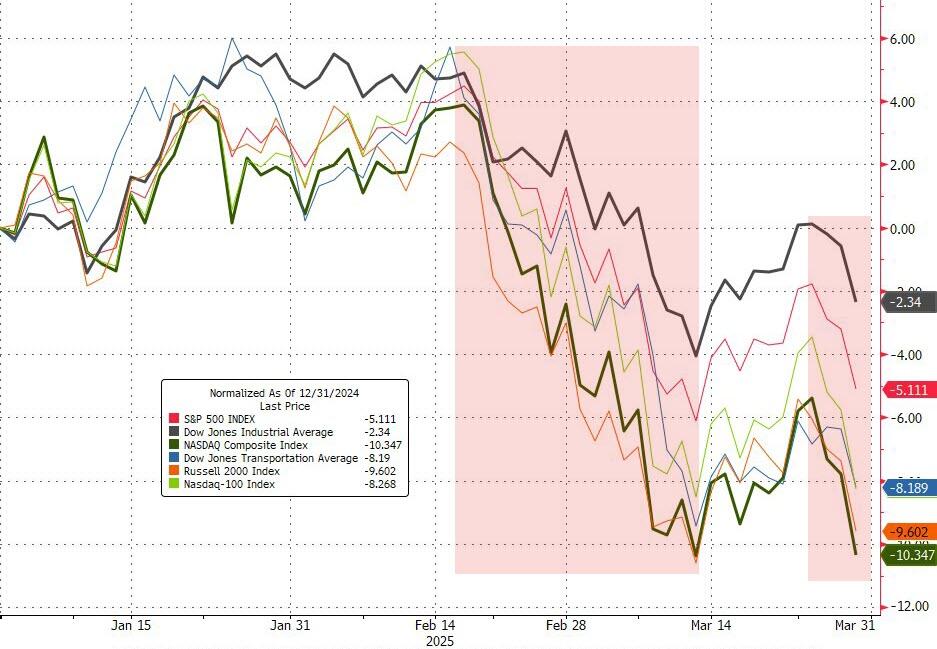
Uncertainty about upcoming tariffs and the latest key inflation data pulled the markets into the red early on, with the downward trend accelerating throughout the session. All major indexes have now set the unfortunate record of being in the red for Q1 2025.
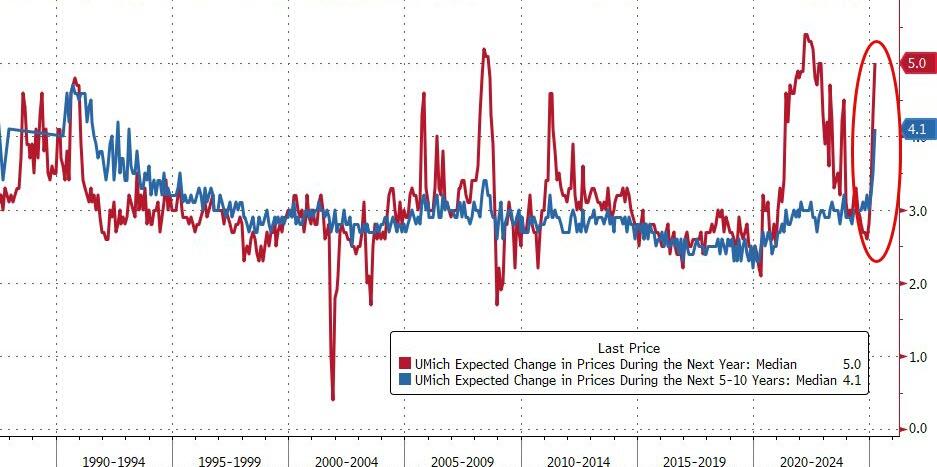
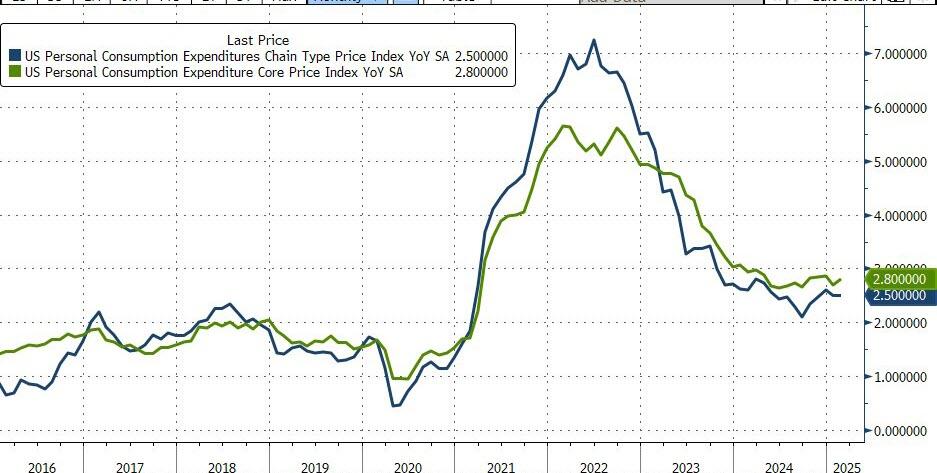
Consumer sentiment for March missed expectations, while the personal consumption expenditures price index (PCE), one of the Fed’s favorite gauges, rose 2.8% in February, slightly higher than expected. This represents a 0.4% increase for the month.
It confirmed fears of persistent inflation, sending the major indexes down and gold surging. Trump’s earlier 25% tariff on all cars not made in the U.S. set a negative tone for stocks, and next week’s increase on April 2nd may not be positive for the markets either.
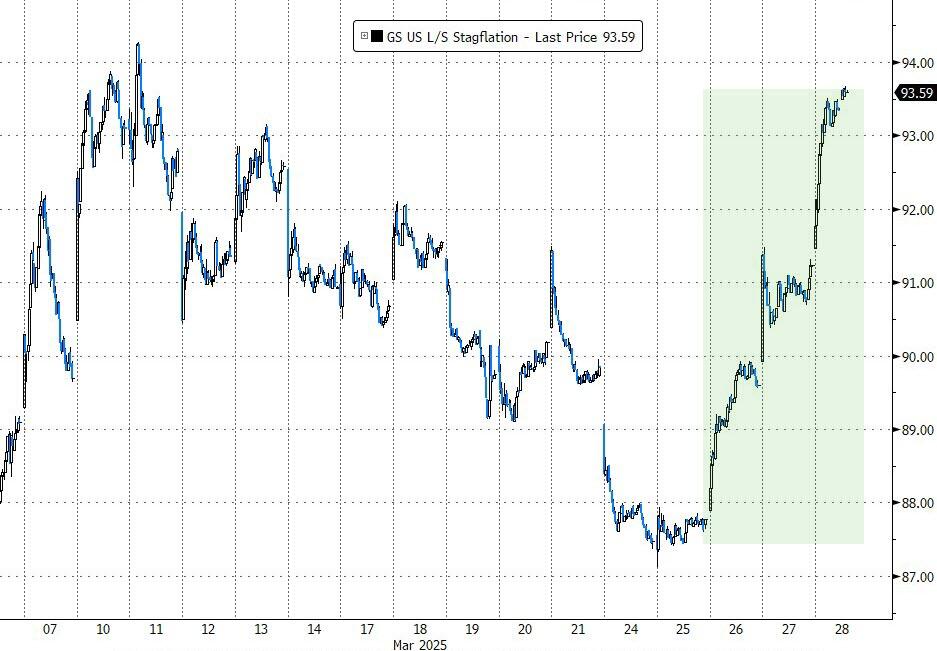
Adding to the bearish sentiment were weaker-than-expected consumer spending figures. Combined with a hotter core PCE and rising inflation expectations, this has intensified concerns about the much-dreaded “stagflation” scenario.
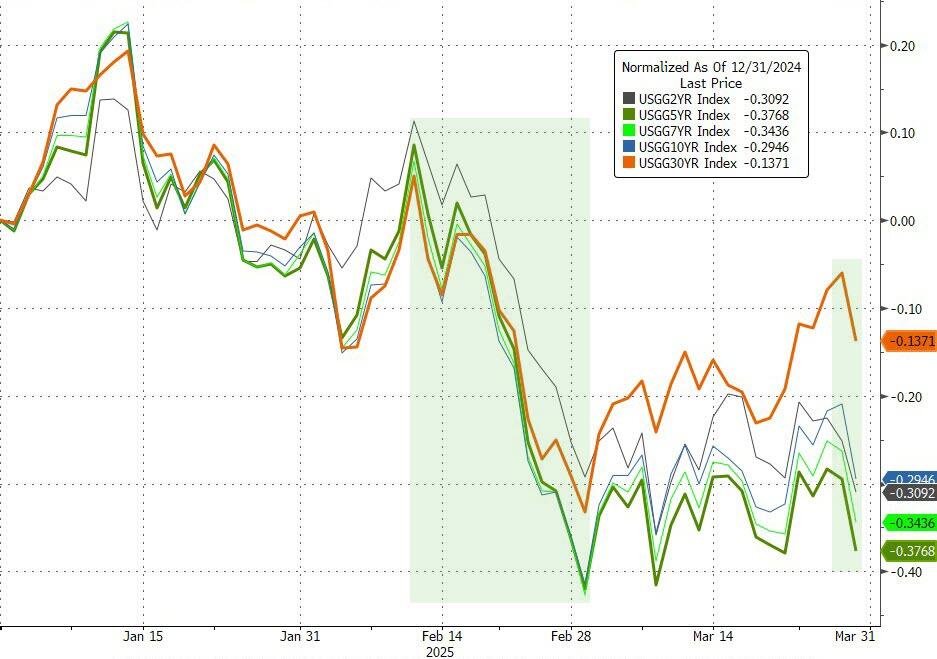
Even dropping bond yields, both today and year-to-date (YTD), were unable to stem the bearish tide.
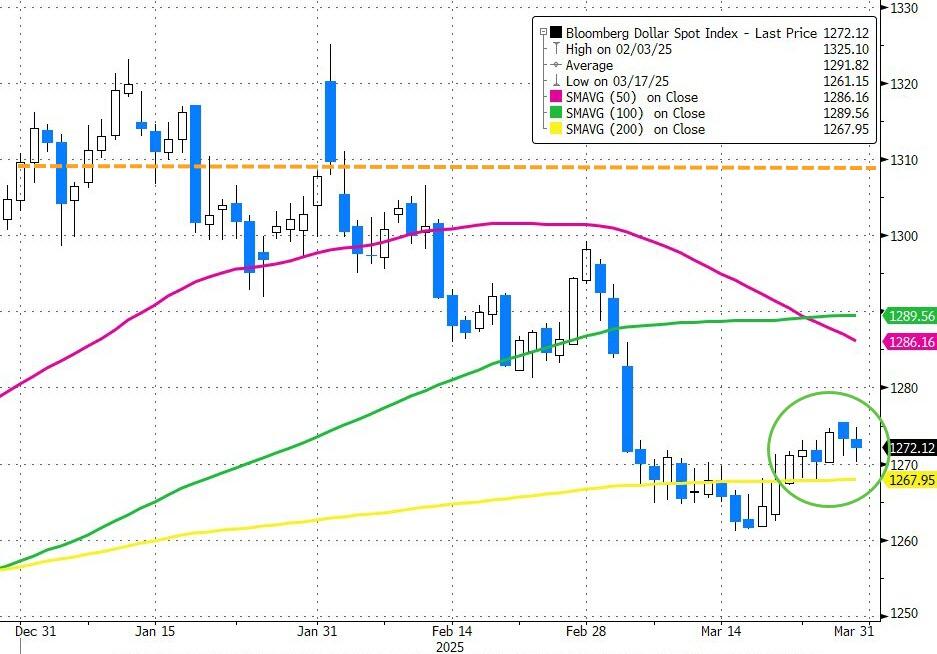
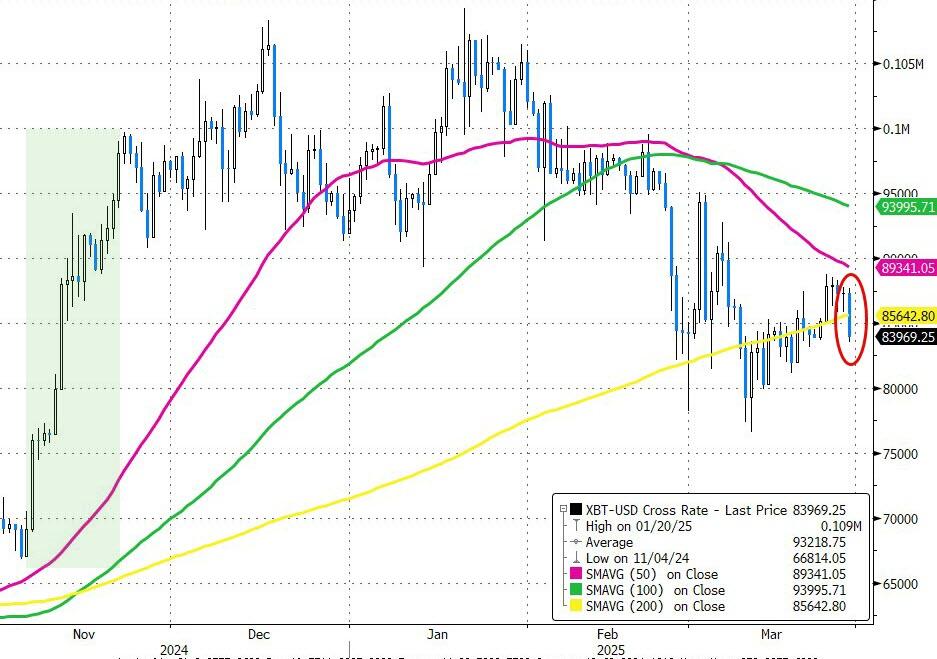
YTD, the dollar ended lower but bounced off its 200-day moving average (200DMA), while Bitcoin also slipped but remains well above pre-election levels, despite breaking below its 200DMA today.
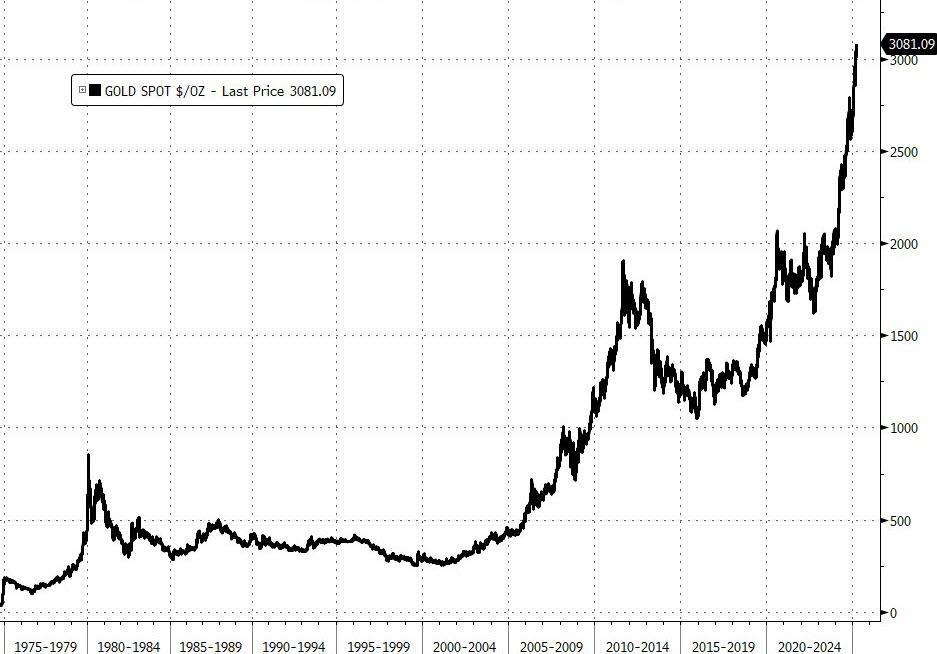
On a positive note, gold was the top performer YTD with a gain of over 17%, marking its best start to a year since 1986. Fortunately, we had a large allocation to this precious metal, which set a record high by crossing the $3,100 level for the first time today.
2. Current “Buy” Cycles (effective 11/21/2023)
Our Trend Tracking Indexes (TTIs) have both crossed their trend lines with enough strength to trigger new “Buy” signals. That means, Tuesday, 11/21/2023, was the official date for these signals.
If you want to follow our strategy, you should first decide how much you want to invest based on your risk tolerance (percentage of allocation). Then, you should check my Thursday StatSheet and Saturday’s “ETFs on the Cutline” report for suitable ETFs to buy.
3. Trend Tracking Indexes (TTIs)
The threat of stagflation dampened bullish sentiment, causing the major indexes to close the week on a negative note.
Our TTIs also pulled back, but to a lesser extent than the indexes. Although the domestic TTI ended 1.96% below its trend line, this isn’t enough to end the current “Buy” cycle.
Next week could be pivotal. If Trump’s tariff announcement on Tuesday is softer than expected, we might see a relief rally that could push our TTI back above its trend line into bullish territory.
Currently, we are in neutral territory and must let the markets dictate our next move. Exiting too early could result in a potential whipsaw signal.
This is how we closed 03/28/2025:
Domestic TTI: -1.96% below its M/A (prior close -0.76%)—Buy signal effective 11/21/2023.
International TTI: +3.44% above its M/A (prior close +5.04%)—Buy signal effective 11/21/2023.
All linked charts above are courtesy of Bloomberg via ZeroHedge.
———————————————————-
WOULD YOU LIKE TO HAVE YOUR INVESTMENTS PROFESSIONALLY MANAGED?
Do you have the time to follow our investment plans yourself? If you are a busy professional who would like to have his portfolio managed using our methodology, please contact me directly to get more details.
Contact Ulli