
ETF Tracker StatSheet
You can view the latest version here.
DISAPPOINTING MACRO DATA AND RISING YIELDS DRIVE MARKET SELL-OFF

- Moving the market
On the final trading day of the holiday week, the major indexes suffered a pullback, with the Nasdaq leading the downturn.
Despite the S&P 500 achieving its best Christmas Eve performance since 1974, today’s correction reduced the index’s gain to less than 0.75% for this shortened holiday week. Nevertheless, traders remain optimistic that the so-called Santa Claus rally, which includes the last five trading days of the year and the first two of the new year, is still on track.
Month-to-date, the major indexes have shown significant divergence. The Nasdaq is up approximately 2%, while the S&P 500 has slipped into the red, and the Dow has declined by over 3%, marking its worst month since April.
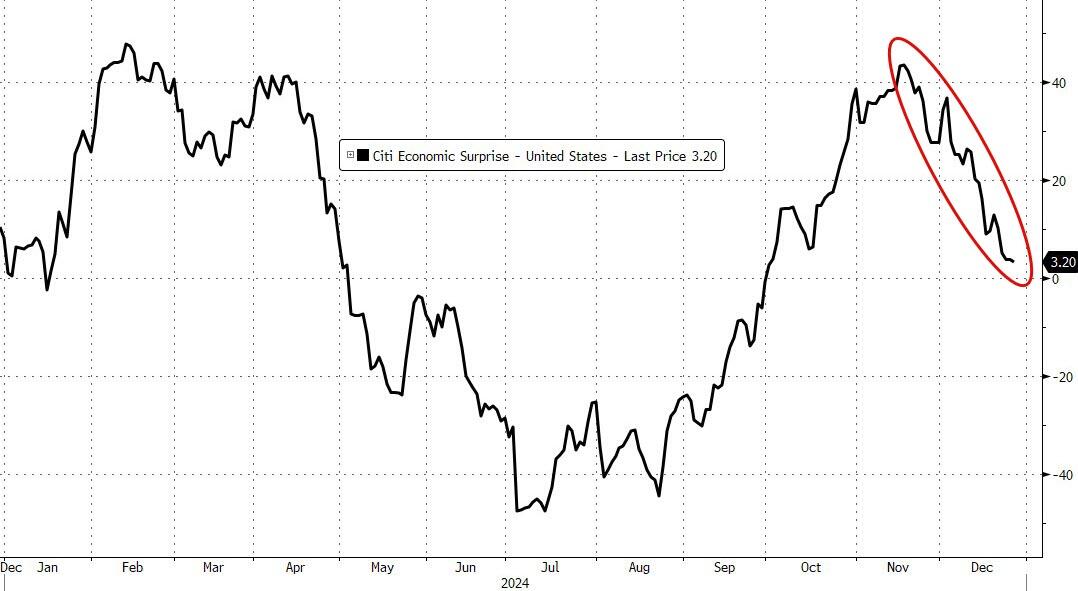
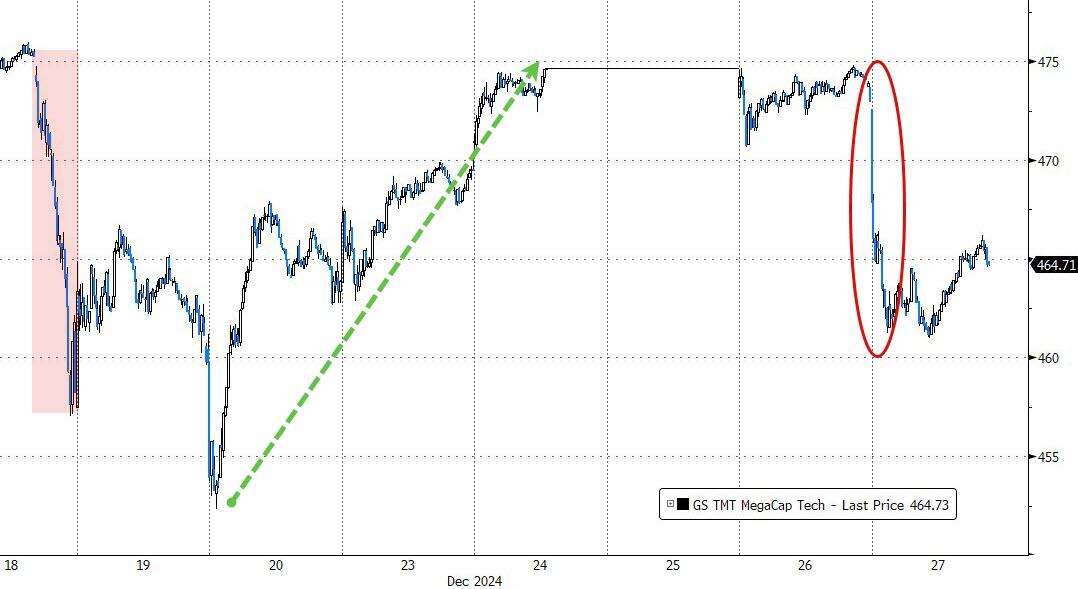
Today’s sell-off was driven by several factors, including another week of disappointing US macroeconomic data, such as shrinking wholesale inventories, year-end rebalancing of pension funds, declining mega-cap stocks, and rising bond yields.
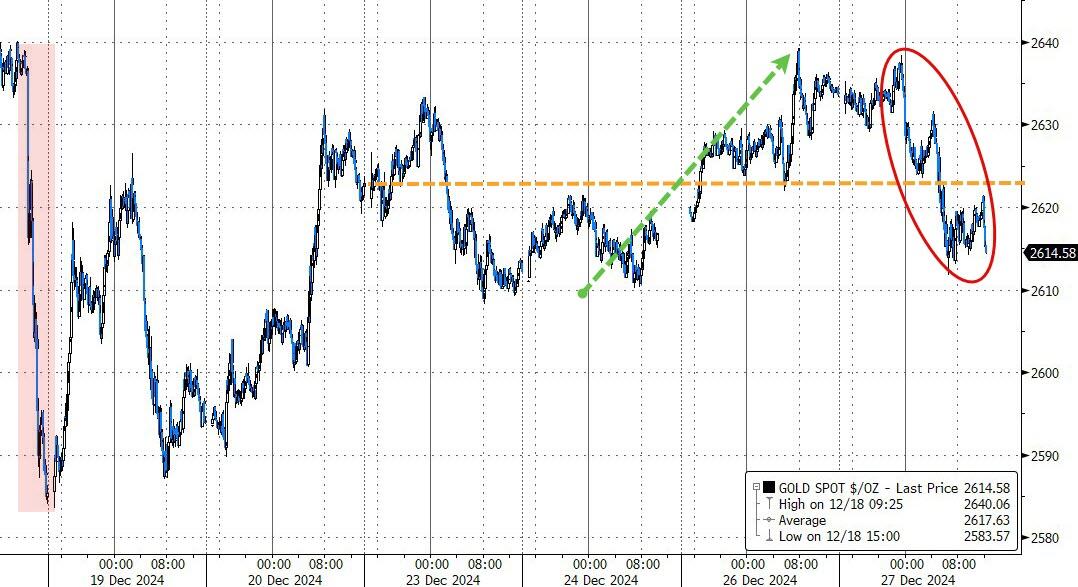
The dollar rallied this week, recovering most of last Friday’s drop. Gold slipped today but ended the four trading days unchanged, while Bitcoin fell below the $100,000 level.
Market confusion persists as traders grapple with the unusual situation where the Fed’s 1% reduction in interest rates has been accompanied by a corresponding 1% rise in bond yields.
Given these developments, I have to wonder: Has the Fed lost its credibility?
2. Current “Buy” Cycles (effective 11/21/2023)
Our Trend Tracking Indexes (TTIs) have both crossed their trend lines with enough strength to trigger new “Buy” signals. That means, Tuesday, 11/21/2023, was the official date for these signals.
If you want to follow our strategy, you should first decide how much you want to invest based on your risk tolerance (percentage of allocation). Then, you should check my Thursday StatSheet and Saturday’s “ETFs on the Cutline” report for suitable ETFs to buy.
3. Trend Tracking Indexes (TTIs)
As soon as the market opened, bearish sentiment dominated, leading to a significant sell-off in equities.
Although there was a weak attempt to recover around midday, it was insufficient to fully reverse the downward trend. However, this effort did manage to lift the major indexes from their lowest points of the day.
Consequently, our TTIs mirrored these market fluctuations and ultimately closed lower.
This is how we closed 12/27/2024:
Domestic TTI: +3.30% above its M/A (prior close +3.79%)—Buy signal effective 11/21/2023.
International TTI: +1.76% above its M/A (prior close +2.03%)—Buy signal effective 11/21/2023.
All linked charts above are courtesy of Bloomberg via ZeroHedge.
———————————————————-
WOULD YOU LIKE TO HAVE YOUR INVESTMENTS PROFESSIONALLY MANAGED?
Do you have the time to follow our investment plans yourself? If you are a busy professional who would like to have his portfolio managed using our methodology, please contact me directly to get more details.
Contact Ulli