- Moving the market
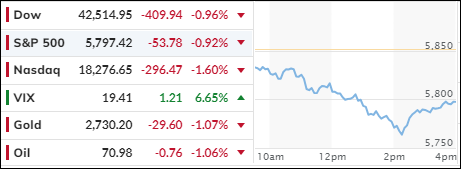
The major indexes began the session on a downward trend for the third consecutive day, as bond yields surged, with the 10-year yield surpassing the 4.25% mark. By the end of the day, the S&P 500 had suffered its steepest decline in seven weeks.
While some traders attribute rising yields to a robust economy, I believe that concerns over the deficit play a more significant role, especially given the current economic instability.
My perspective was reinforced today when it was revealed that US Existing Home Sales fell to their lowest level since 2010, dropping 1% month-over-month (MoM) against expectations of a 0.5% MoM increase—a substantial miss. Although August’s 2.5% MoM decline was revised to a 2% MoM drop, sales for the year were still down 3.5%.
Despite short-term weakness and volatility being common in any bull market, the recent pullbacks have remained within expected ranges, indicating that the long-term trend is still positive.
However, the current political and geopolitical climate sets up the possibility of a significant directional shift, even as we approach a typically strong seasonal period. Today’s 1% drop is still considered a moderate correction.
The MAG7 basket suffered, with tech giants Apple and Nvidia losing 2.16% and 2.81%, respectively. The most shorted stocks continued to lose upward momentum. The dollar ended the session stronger, approaching its July highs.
Gold could not withstand the strength of the dollar and rising yields, relinquishing the gains of the past three days. Similarly, Bitcoin fell below $66,000, and crude oil slipped but managed to hold its $71 price level.
If today is any indication, volatility will continue to be with us throughout the election period.
2. Current “Buy” Cycles (effective 11/21/2023)
Our Trend Tracking Indexes (TTIs) have both crossed their trend lines with enough strength to trigger new “Buy” signals. That means, Tuesday, 11/21/2023, was the official date for these signals.
If you want to follow our strategy, you should first decide how much you want to invest based on your risk tolerance (percentage of allocation). Then, you should check my Thursday StatSheet and Saturday’s “ETFs on the Cutline” report for suitable ETFs to buy.
3. Trend Tracking Indexes (TTIs)
The market underwent a significant downturn, with bullish sentiment completely absent. The rise in bond yields dampened any upward momentum, resulting in a widespread decline across the markets.
Consequently, our TTIs were unable to resist the bearish pressure and closed the day with moderate losses.
This is how we closed 10/23/2024:
Domestic TTI: +7.54% above its M/A (prior close +7.90%)—Buy signal effective 11/21/2023.
International TTI: +5.47% above its M/A (prior close +6.06%)—Buy signal effective 11/21/2023.
All linked charts above are courtesy of Bloomberg via ZeroHedge.
———————————————————-
WOULD YOU LIKE TO HAVE YOUR INVESTMENTS PROFESSIONALLY MANAGED?
Do you have the time to follow our investment plans yourself? If you are a busy professional who would like to have his portfolio managed using our methodology, please contact me directly to get more details.
Contact Ulli