
- Moving the markets
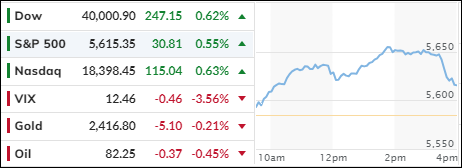
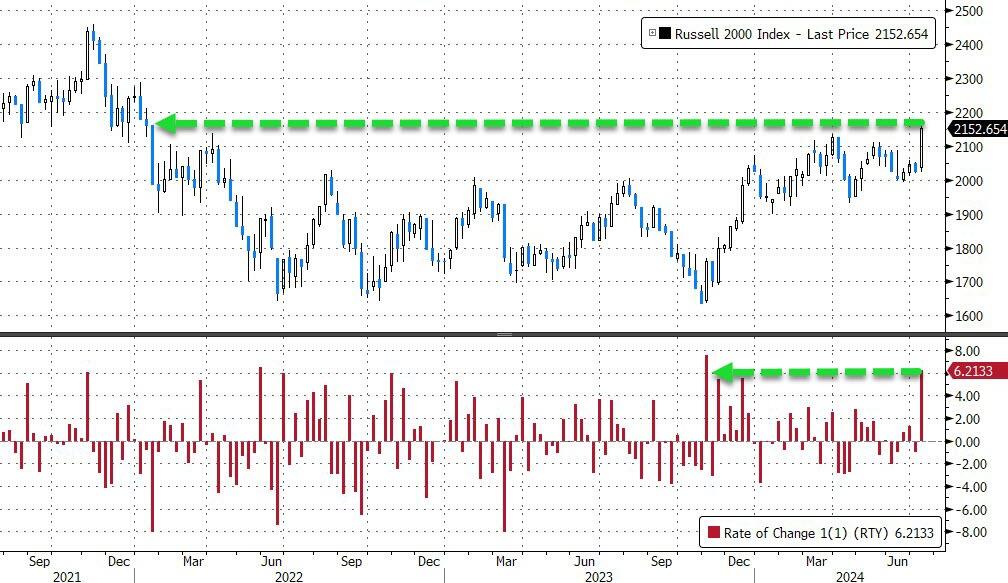
After yesterday’s pullback, bullish sentiment resurfaced, and the major indexes stormed ahead and closed solidly in the green. The rally was broad based, which helped some of the non-tech areas to scoop up some gains, with especially Small Caps scoring their best week in 8 months. An enormous short squeeze provided the necessary firepower.
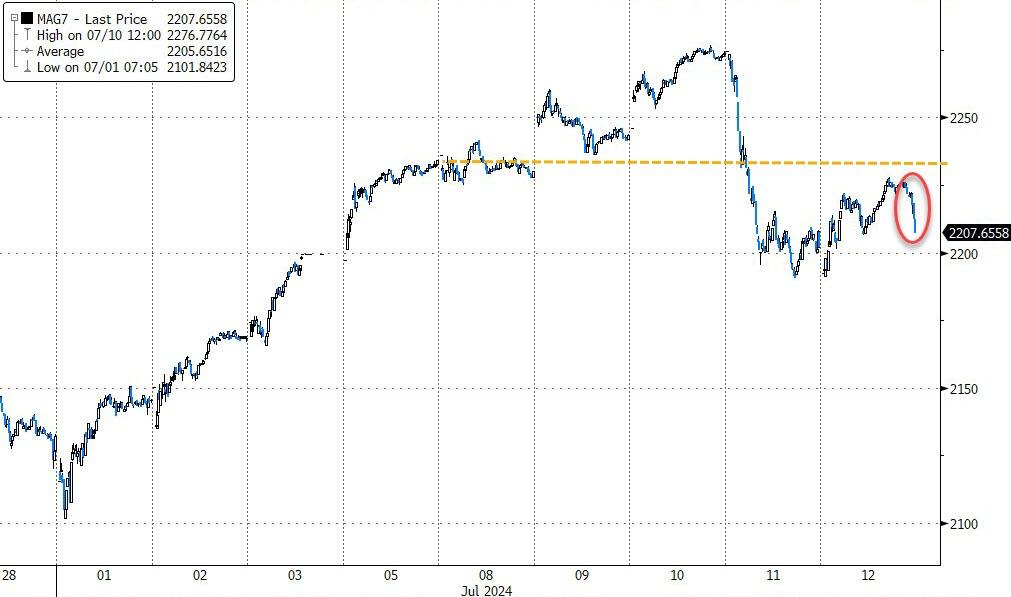
The tech sector also snapped back with bargain hunters picking up some favorite names like Nvidia and Apple. But the MAG7 stocks ended the week lower.
Banks kicked off the earnings season, but even stronger than expected results failed to lift that area.
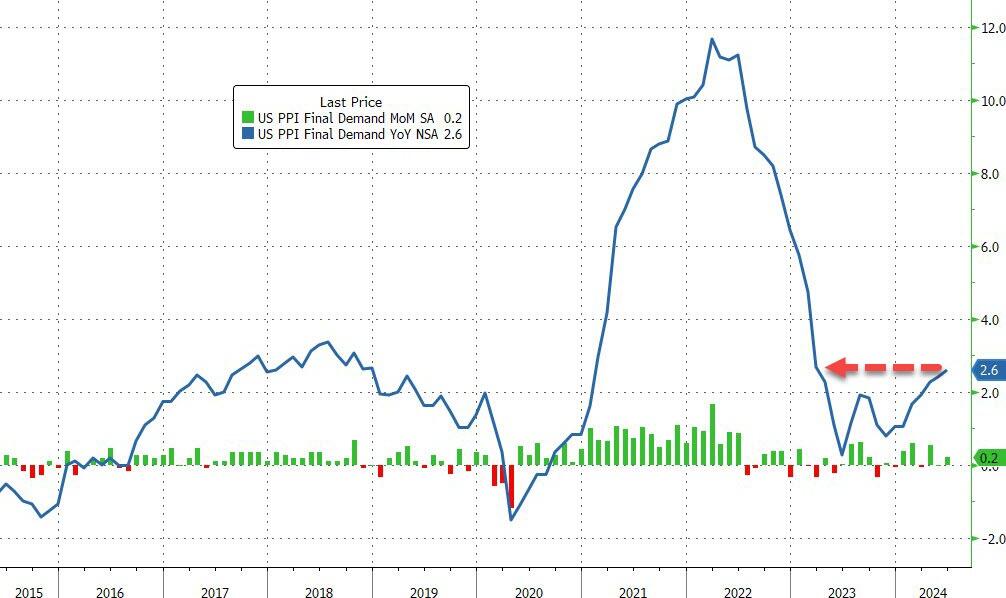
The much-anticipated PPI came in at the fastest pace in 15 months, which pushed the YoY number up to 2.6% vs. expectations of 2.3%. However, traders simply ignored those numbers and still focused on yesterday’s drop in consumer prices, which increased optimism that the Fed would finally initiate a rate cut in September. Since there will be no Fed meeting in August, the September time frame is now in focus.
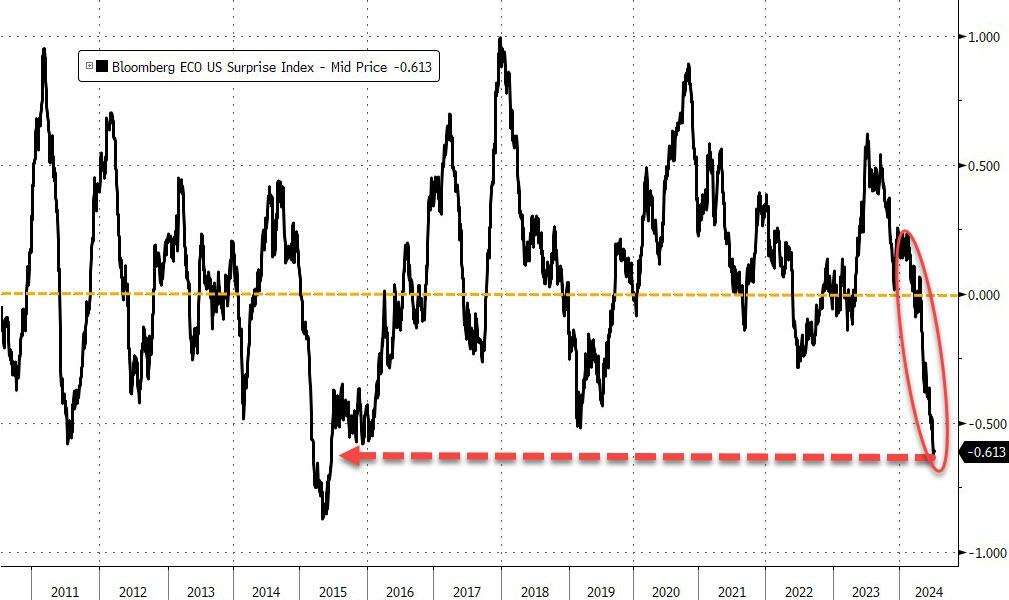
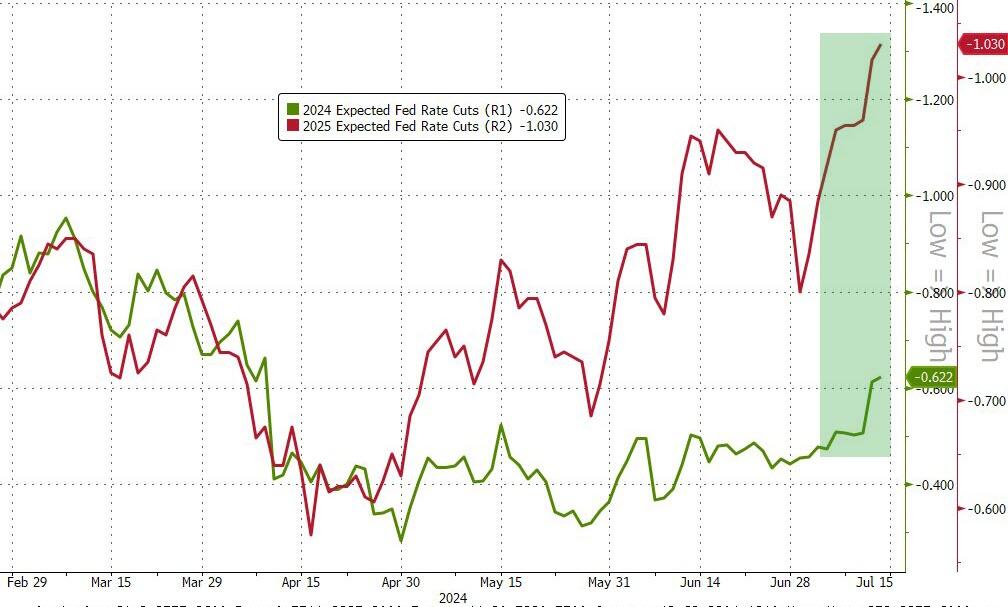
Despite market optimism, the week was bad when it came to data releases, as the Economic Surprise Index took a dive and closed at lows last seen in 2015. In terms of rate-cut expectations that was good news, and they resumed their upward trend.
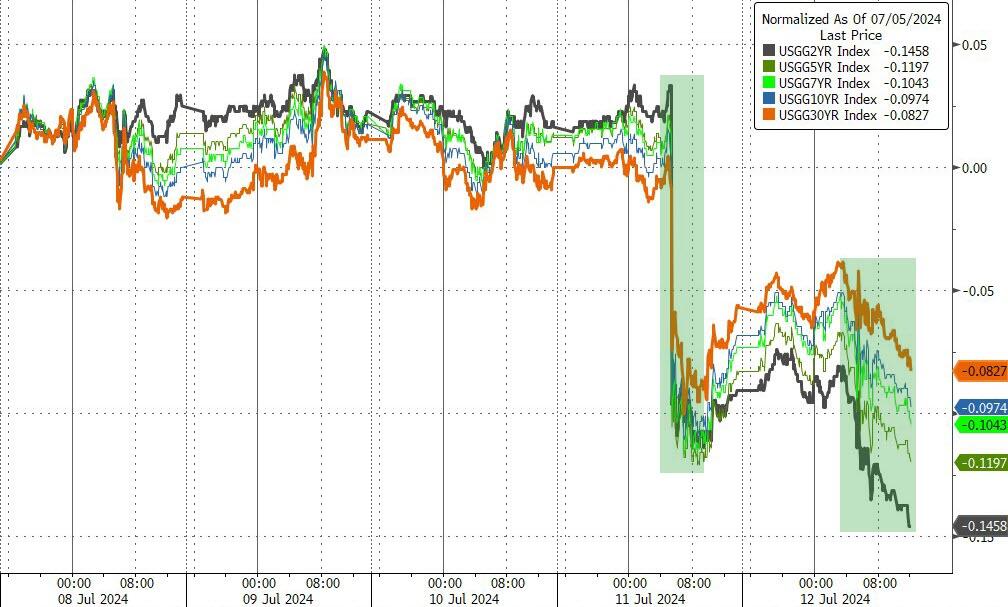
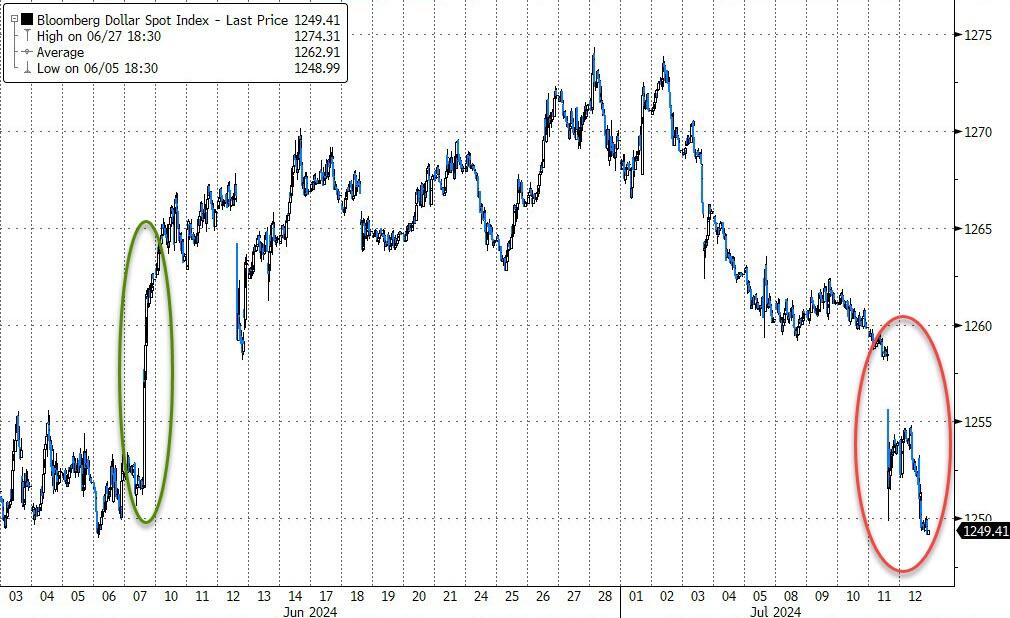
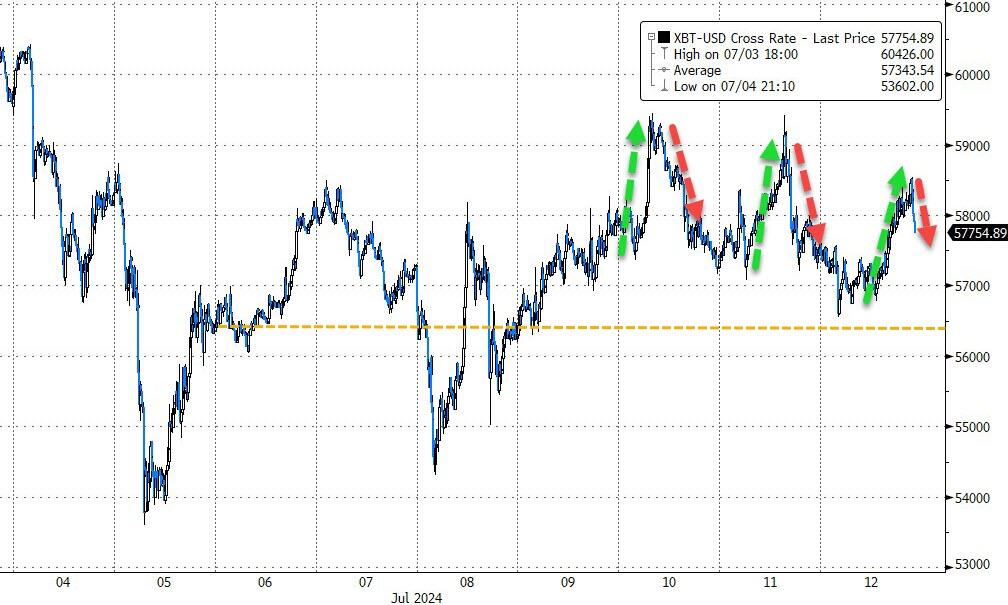
Bond yields tumbled, as the dollar dropped and wiped out all returns since early June. Bitcoin eked out a gain for the week, despite the German government dumping all their coins for unexplainable reasons.
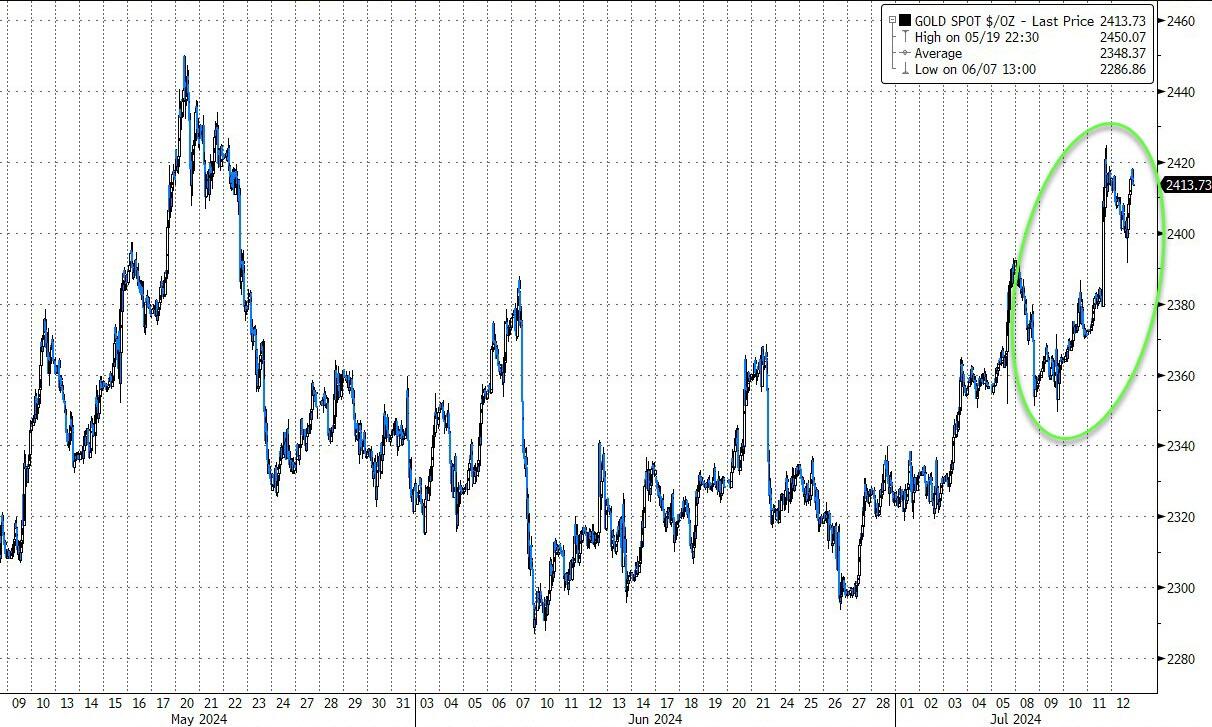
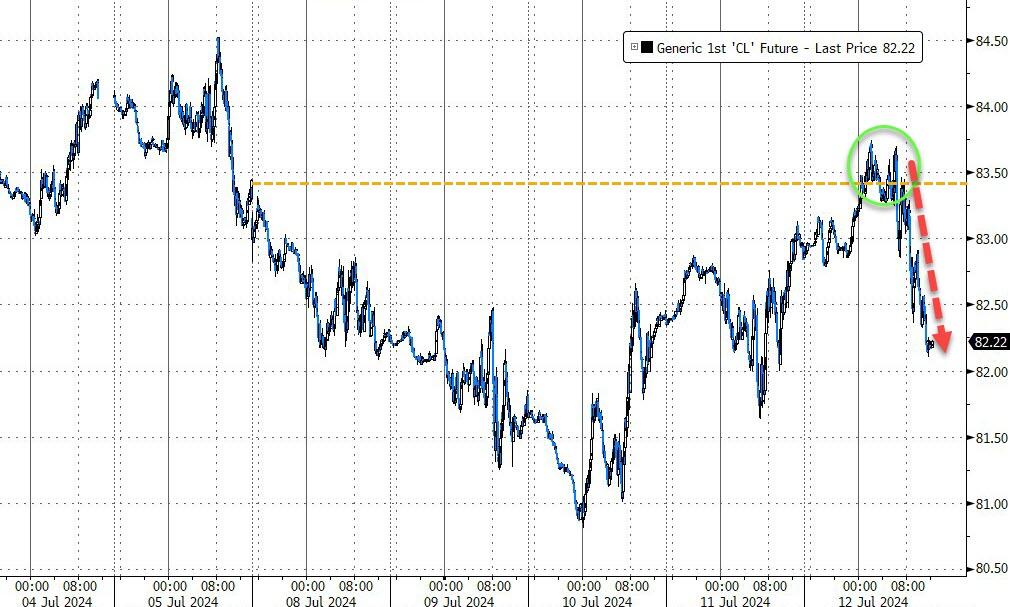
Gold surged and is approaching its record highs, but crude oil, despite a valiant attempt, surrendered its $83.50 level.
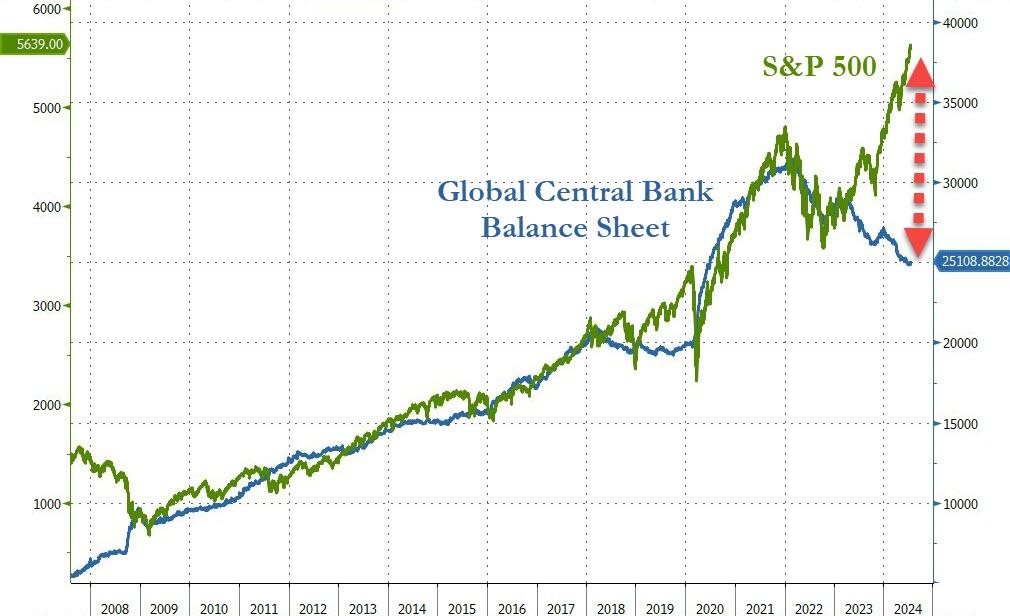
With the S&P 500’s reckless advances in the face of shrinking Global Central Bank balance sheets, I am pondering:
Are traders expecting a massive inflow of liquidity to justify this huge divergence?
If that does not occur, this alligator snout will snap shut in a hurry.
2. Current “Buy” Cycles (effective 11/21/2023)
Our Trend Tracking Indexes (TTIs) have both crossed their trend lines with enough strength to trigger new “Buy” signals. That means, Tuesday, 11/21/2023, was the official date for these signals.
If you want to follow our strategy, you should first decide how much you want to invest based on your risk tolerance (percentage of allocation). Then, you should check my Thursday StatSheet and Saturday’s “ETFs on the Cutline” report for suitable ETFs to buy.
3. Trend Tracking Indexes (TTIs)
Despite a worse than expected PPI, traders ignored the report and focused on the Fed’s current 80% odds of a rate-cut in September. Nothing else mattered.
With the rebound being broad based, our TTIs closed higher as well.
This is how we closed 07/12/2024:
Domestic TTI: +7.05% above its M/A (prior close +6.64%)—Buy signal effective 11/21/2023.
International TTI: +8.41% above its M/A (prior close +8.33%)—Buy signal effective 11/21/2023.
All linked charts above are courtesy of Bloomberg via ZeroHedge.
———————————————————-
WOULD YOU LIKE TO HAVE YOUR INVESTMENTS PROFESSIONALLY MANAGED?
Do you have the time to follow our investment plans yourself? If you are a busy professional who would like to have his portfolio managed using our methodology, please contact me directly to get more details.
Contact Ulli