
- Moving the markets
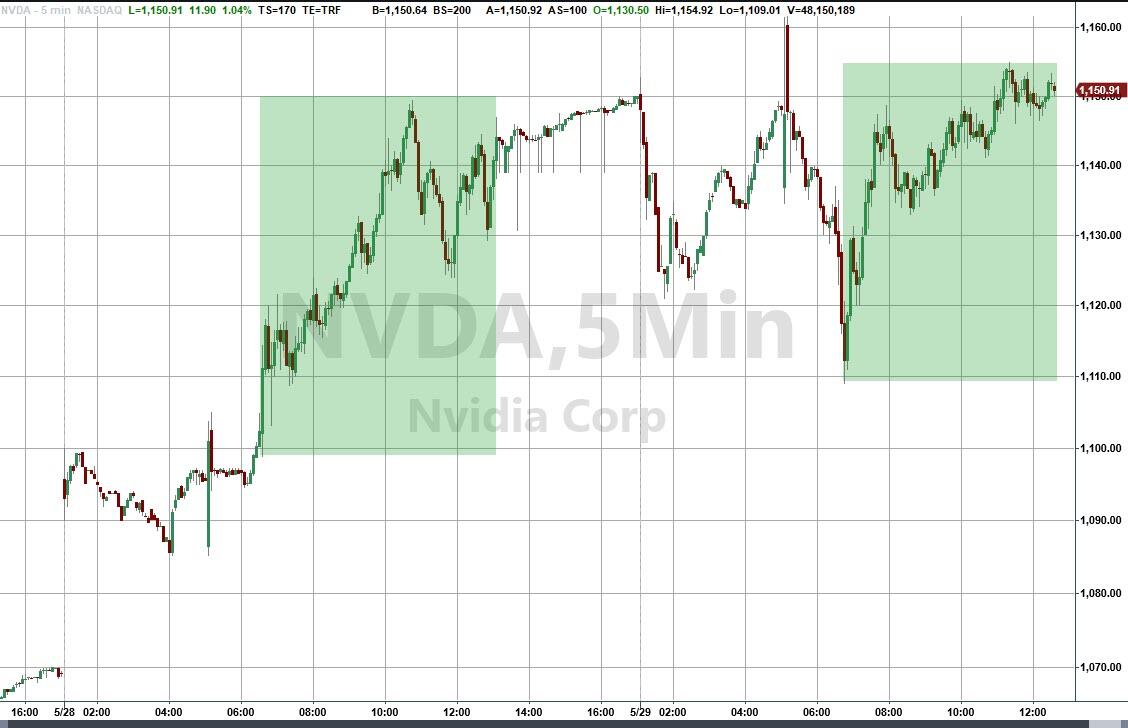
All focus was on Nvidia, with the tech darling dumping and pumping and having a volatile session. It vacillated sharply around its unchanged line and was in danger of scoring its first negative session since its blowout earnings.
In the end, the stock closed higher by a scant +0.8%, but it hit a new record high.
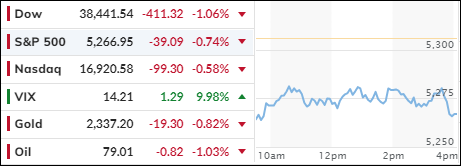
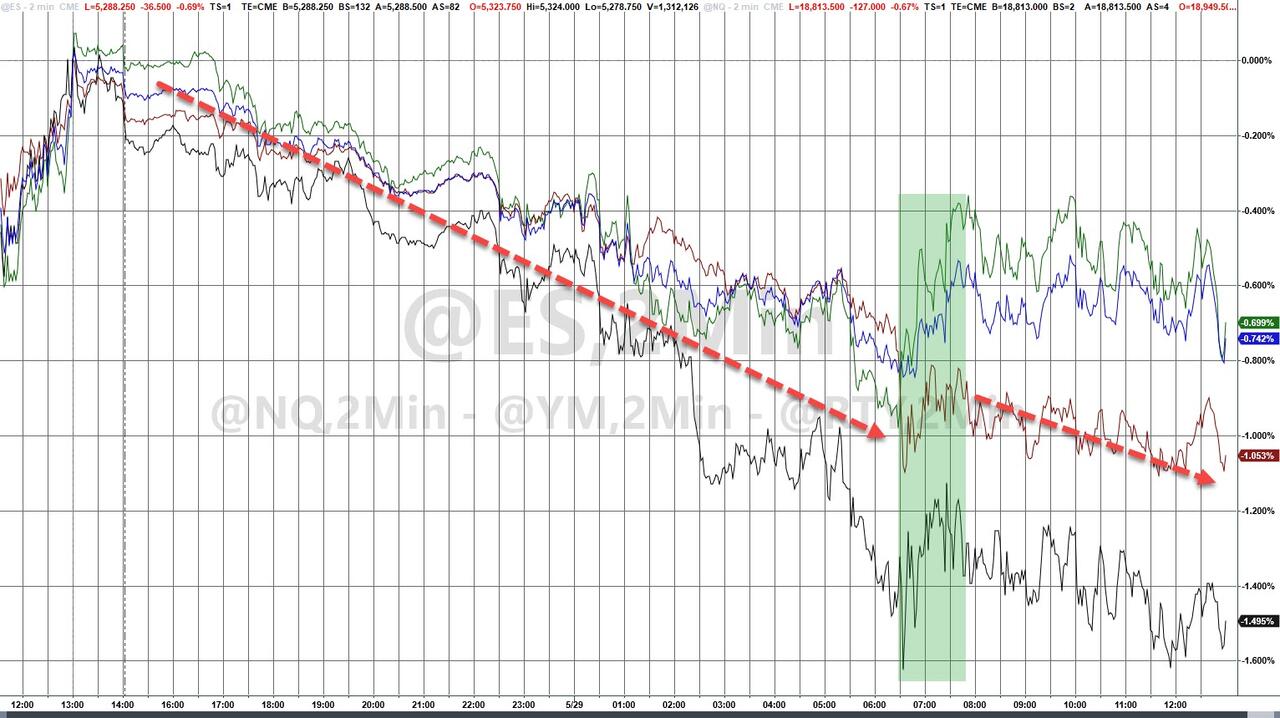
Nevertheless, the major indexes were affected by that volatility, as this last bastion of strength rattled traders’ nerves. The major indexes headed south led by the Dow with a loss of over 1%, while breaking its 50-day and 100-day M/A.
The pullback was broad, with all 11 S&P sectors trading down and 450 members of the index being lower as well. The Dow showed a similar fate, while more than two-thirds of its components slipped into the red.
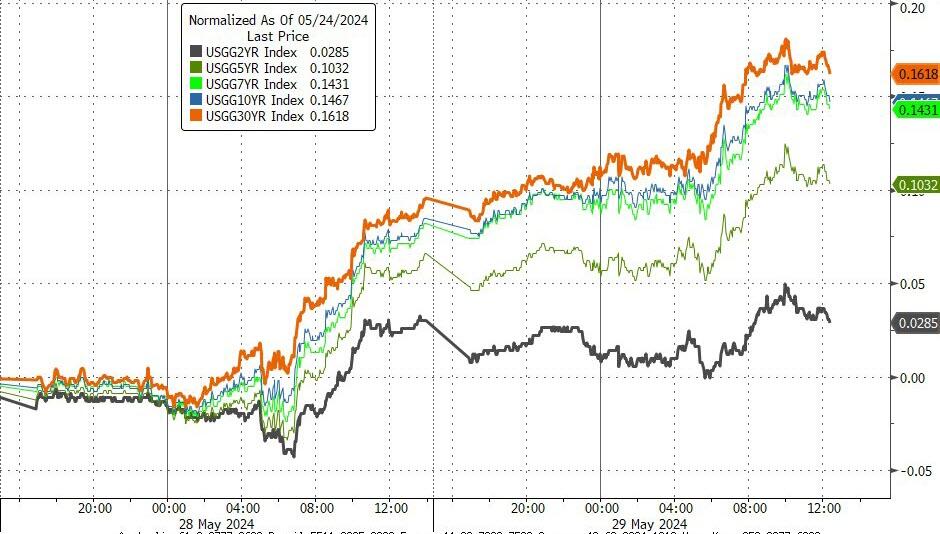
Not helping matters were bond yields, which ticked higher for the second day, as the 10-year popped above 4.6%, a level that can be troublesome for market direction. A weak Treasury auction disappointed but gave the bearish crowd a moment to cheer.
Still, month to date, the majors are up with the Nasdaq leading the pack with a gain of around 8%, followed by the S&P 500 with an almost 5% advance.
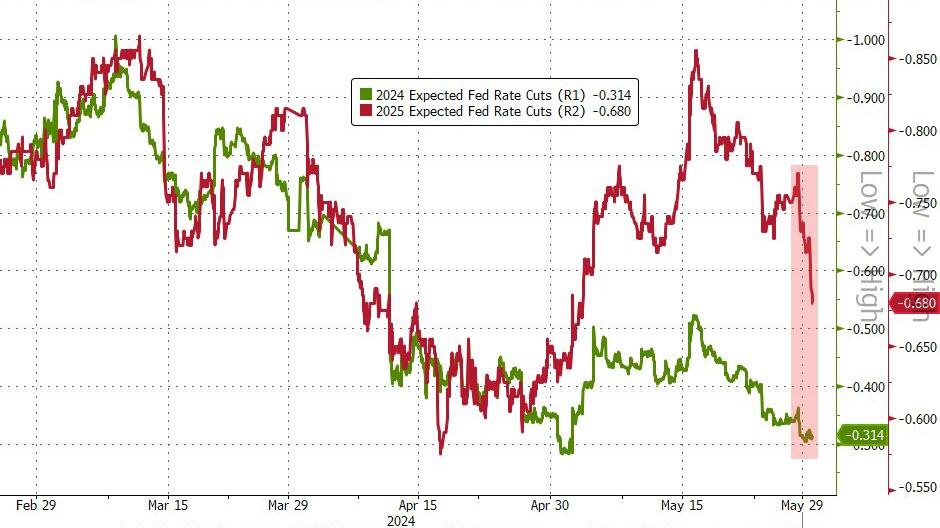
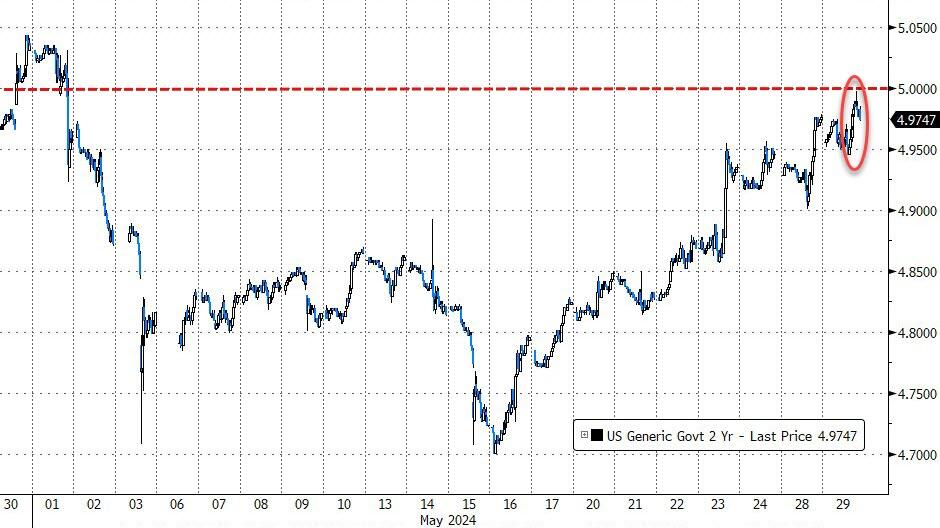
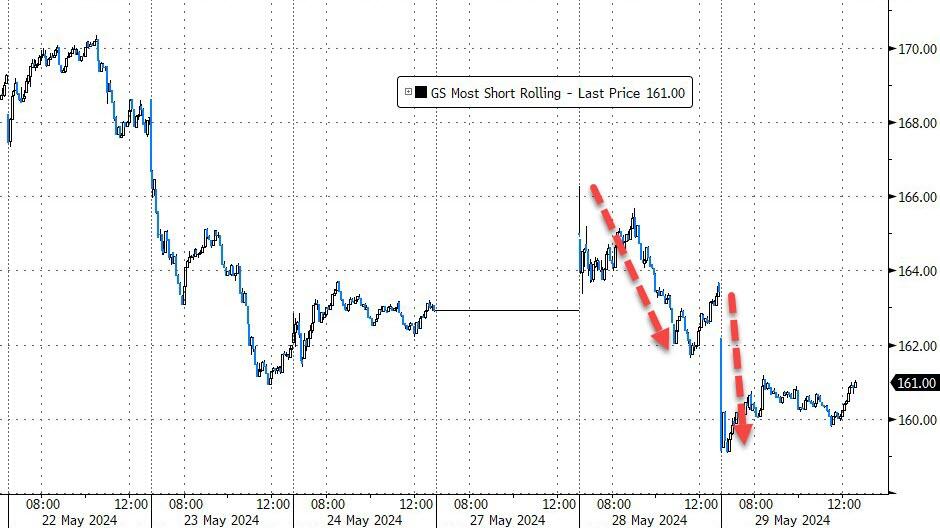
The session was a mixed bag, as rate-cut expectations headed south, and bond yields surged, with the 2-year attacking its 5% level but failing to conquer it. The most shorted stocks did what they do best in this environment, namely imitating a swan dive.
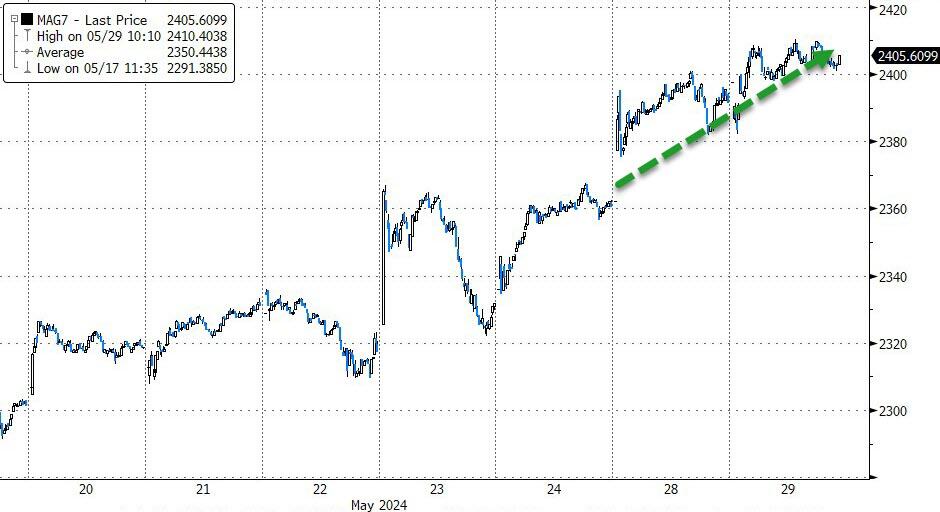
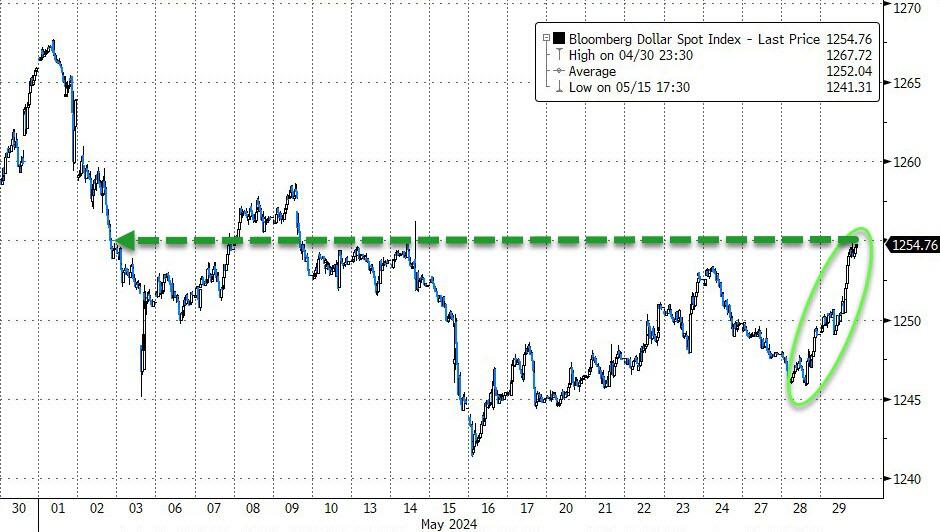
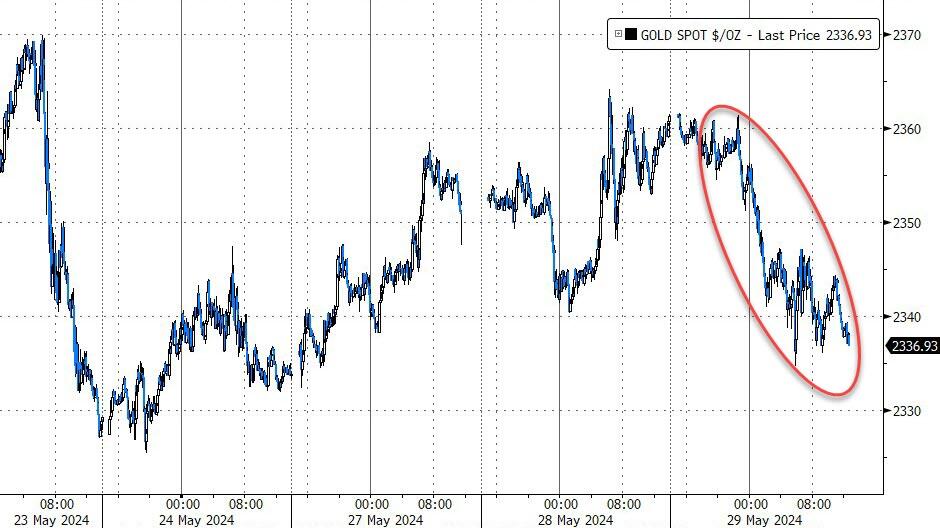
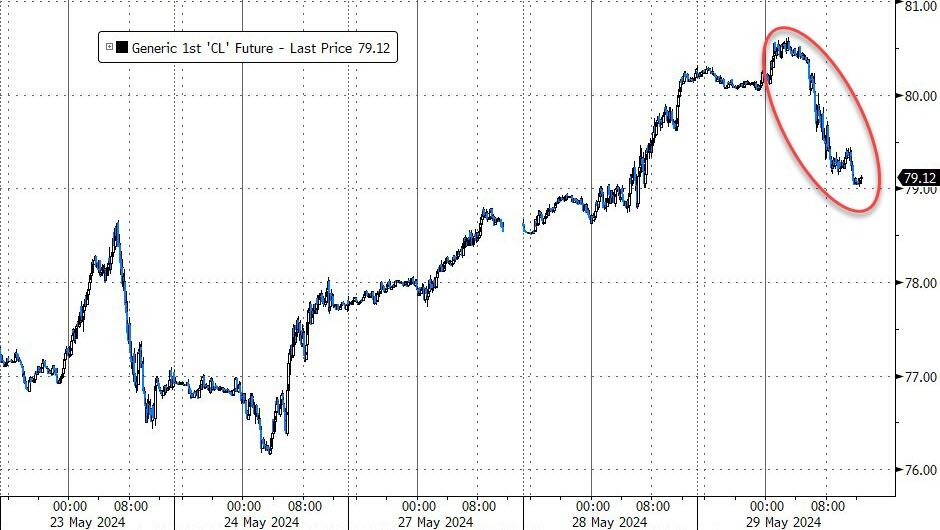
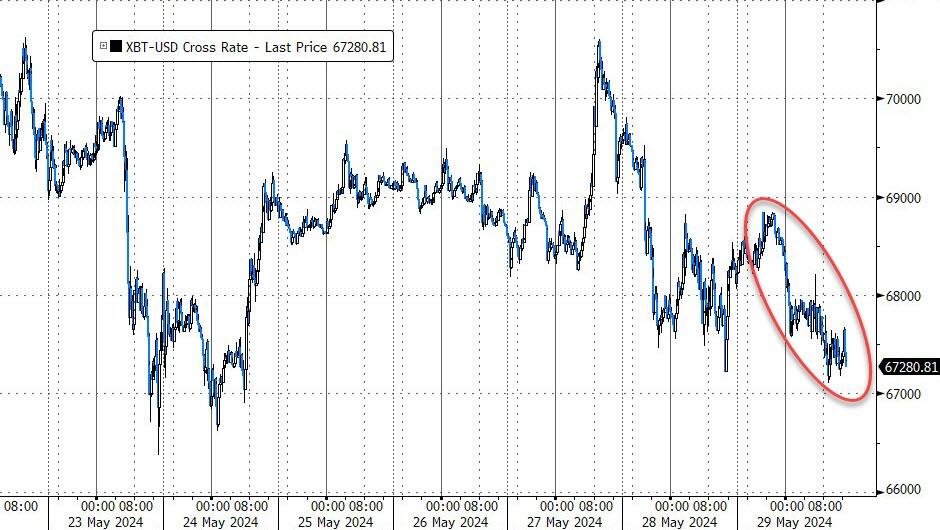
Surprisingly, the MAG7 stocks bucked the trend and headed higher. The dollar followed rates and cruised to its early May level, which triggered a sell-off in gold and crude oil. Bitcoin showed weakness as well and meandered back down to its $68k range.
Will the markets succumb to more weakness, or will they be able end the month of May with a bang to the upside? There are only two days left.
2. Current “Buy” Cycles (effective 11/21/2023)
Our Trend Tracking Indexes (TTIs) have both crossed their trend lines with enough strength to trigger new “Buy” signals. That means, Tuesday, 11/21/2023, was the official date for these signals.
If you want to follow our strategy, you should first decide how much you want to invest based on your risk tolerance (percentage of allocation). Then, you should check my Thursday StatSheet and Saturday’s “ETFs on the Cutline” report for suitable ETFs to buy.
3. Trend Tracking Indexes (TTIs)
Red was the color of the day, as the markets could not overcome the surge in bond yields, with the major indexes taking a dive and failing to recover.
Our TTIs were not exempt and came off their lofty levels, but they did not affect our current positive stance on equities.
This is how we closed 5/29/2024:
Domestic TTI: +5.78% above its M/A (prior close +6.99%)—Buy signal effective 11/21/2023.
International TTI: +7.68% above its M/A (prior close +9.09%)—Buy signal effective 11/21/2023.
All linked charts above are courtesy of Bloomberg via ZeroHedge.
———————————————————-
WOULD YOU LIKE TO HAVE YOUR INVESTMENTS PROFESSIONALLY MANAGED?
Do you have the time to follow our investment plans yourself? If you are a busy professional who would like to have his portfolio managed using our methodology, please contact me directly to get more details.
—————————————————————-
Contact Ulli