

- Moving the markets
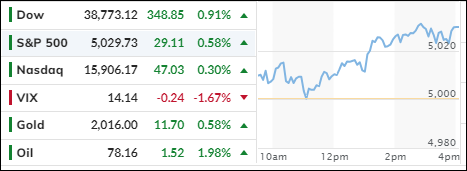
The stock market had a strong finish today, with the S&P 500 hitting a new record high and the other major indexes recovering from their earlier losses in the week.
But don’t pop the champagne just yet because the economic picture is still murky at best.
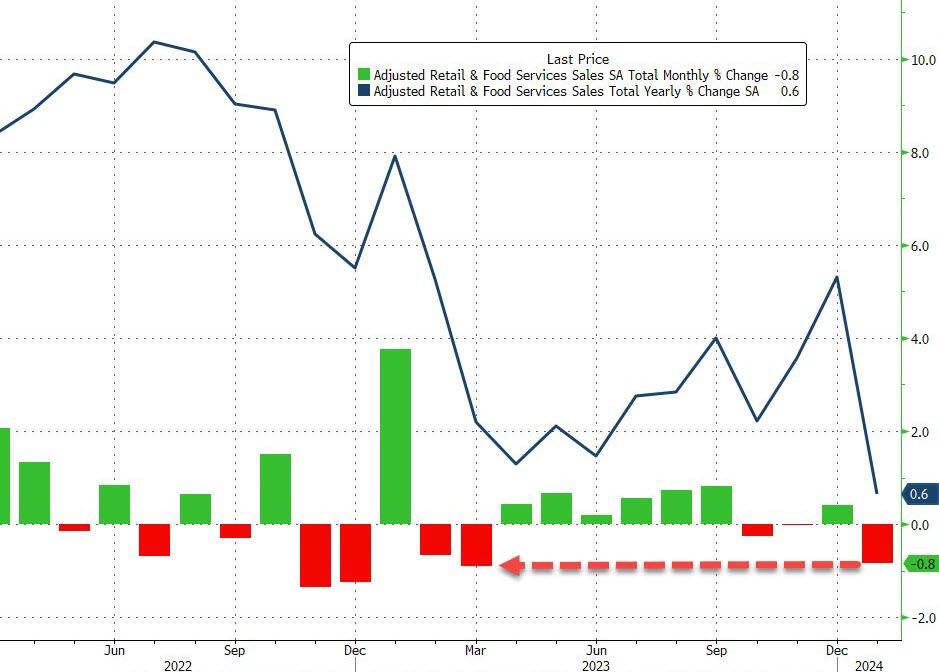
Retail sales fell more than expected in January, dropping 0.8% from the previous month. That’s a bad sign for the U.S. consumer, who is feeling the pinch of rising prices and higher interest rates.
Treasury yields also fell, reflecting the gloomy mood of the market. The earnings season didn’t help much either. Some companies, like Tripadvisor, beat expectations and saw their shares soar 9%. Others, like Cisco, disappointed the investors and announced job cuts and lower sales forecasts. Their shares dropped 2%.
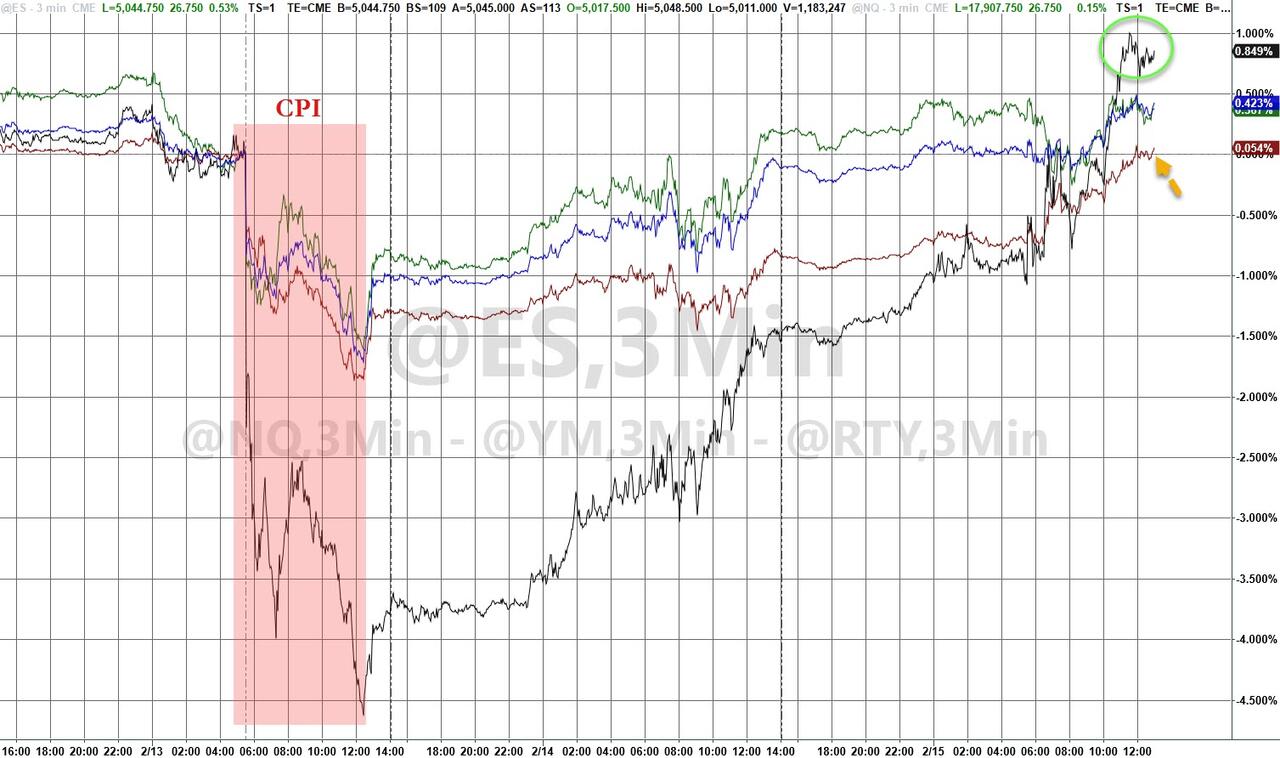
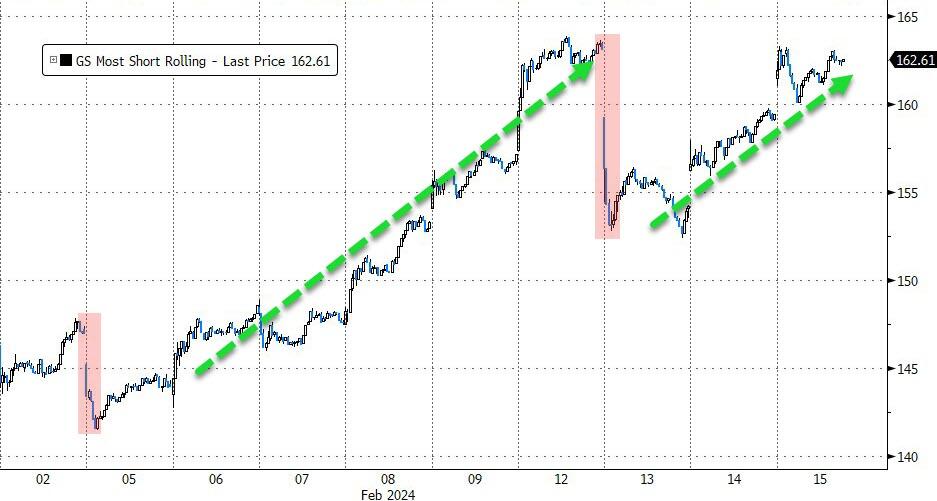
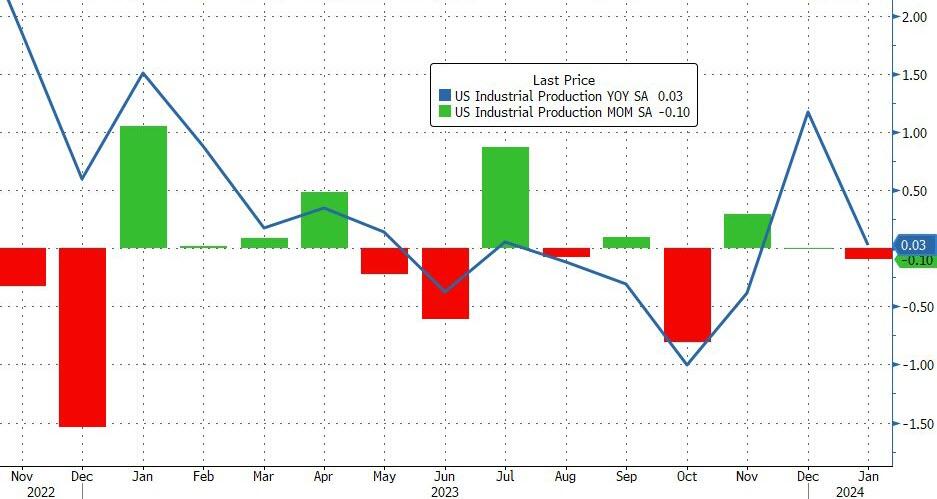
The star performers of the day were the Small Caps, which rose 2.5% thanks to a short squeeze. They managed to overcome the negative effects of bad retail sales and the dismal manufacturing report. The latter showed that U.S. factory output barely changed in January, staying flat from a year ago.
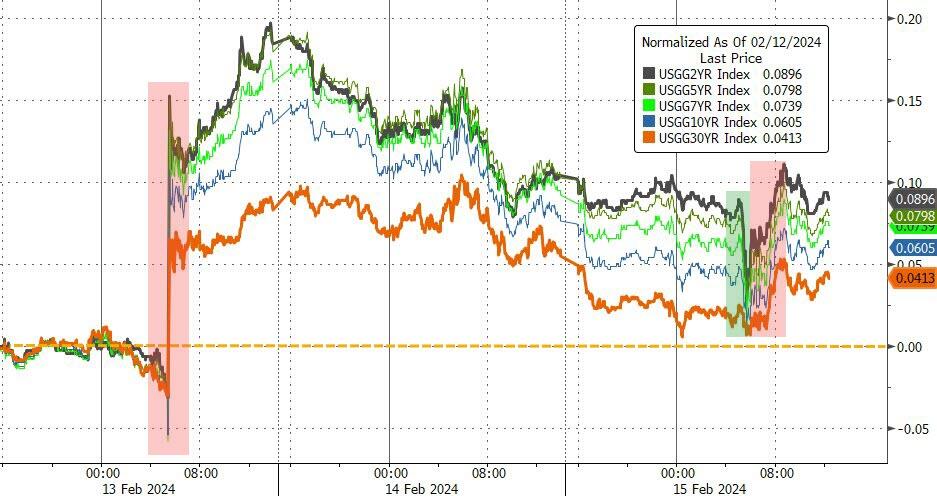
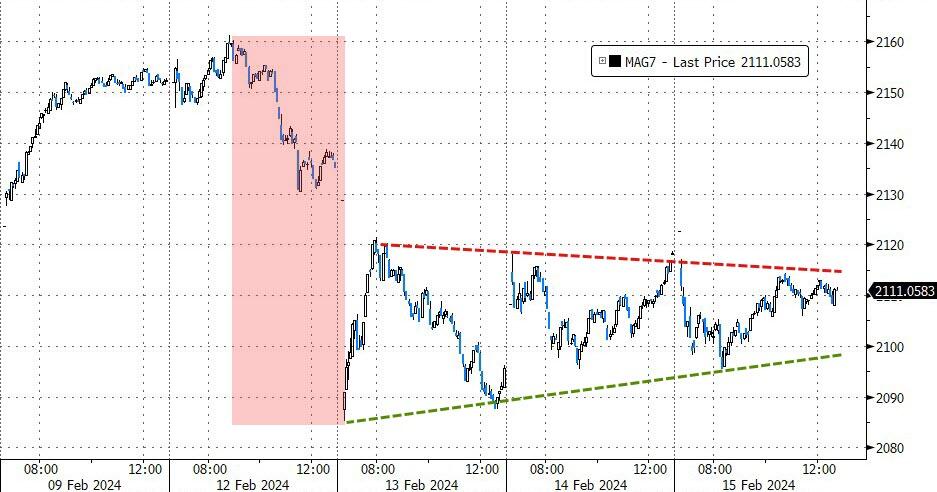
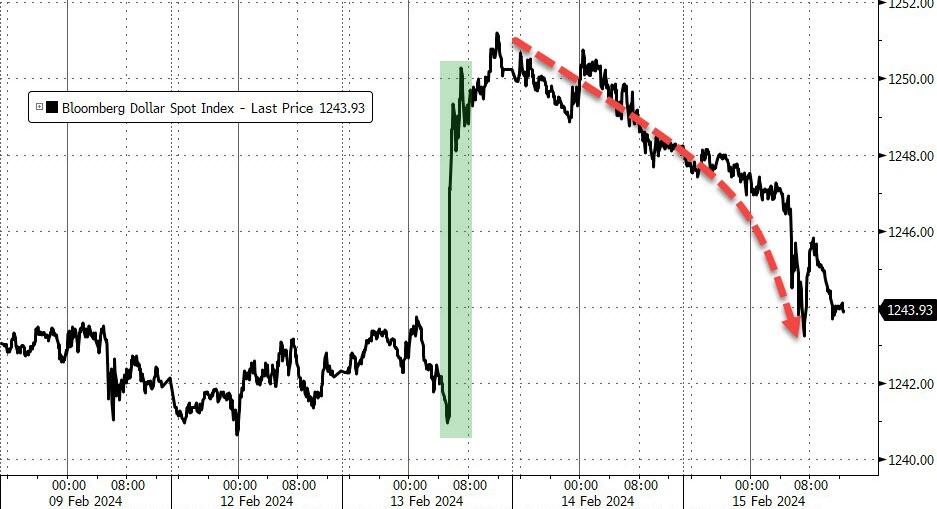
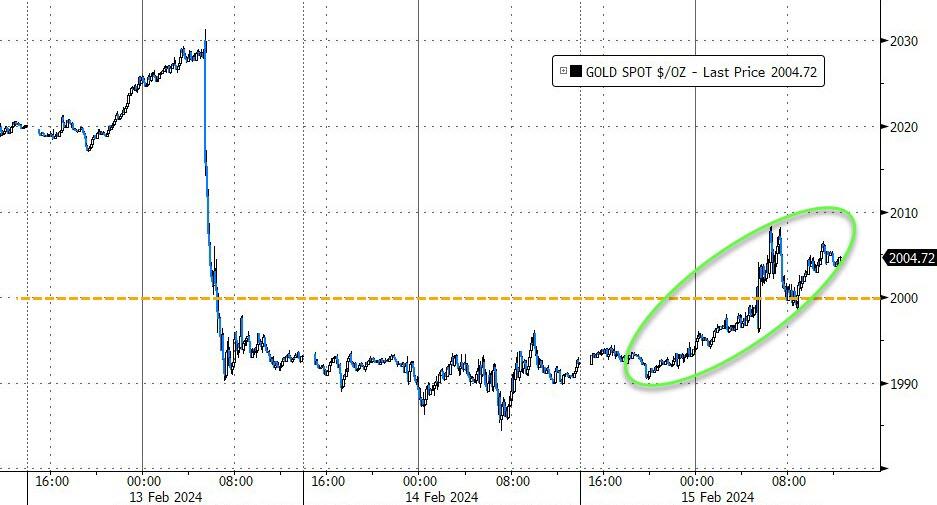
Meanwhile, bond yields dipped slightly, the Mag7 stocks (Microsoft, Apple, Google, Amazon, Facebook, Netflix, and Tesla) stagnated, the dollar weakened, and gold climbed back above $2,000 an ounce.
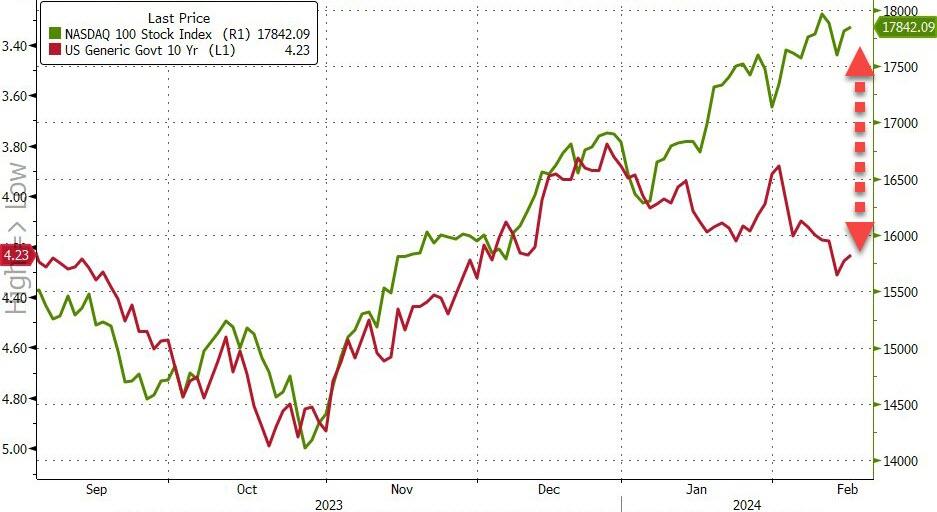
The most puzzling thing, however, is the widening gap between the Nasdaq 100 and the 10-year yield, as shown in this chart.
The question is: Will the tech stocks fall, or will the bond yields rise to close this alligator jaw?
2. Current “Buy” Cycles (effective 11/21/2023)
Our Trend Tracking Indexes (TTIs) have both crossed their trend lines with enough strength to trigger new “Buy” signals. That means, Tuesday, 11/21/2023, was the official date for these signals.
If you want to follow our strategy, you should first decide how much you want to invest based on your risk tolerance (percentage of allocation). Then, you should check my Thursday StatSheet and Saturday’s “ETFs on the Cutline” report for suitable ETFs to buy.
3. Trend Tracking Indexes (TTIs)
The stock market rose today, with smaller companies outperforming larger ones. This boosted our indicators that track the direction of the market, making them more positive.
This is how we closed 2/15/2024:
Domestic TTI: +8.84% above its M/A (prior close +7.51%)—Buy signal effective 11/21/2023.
International TTI: +7.71% above its M/A (prior close +6.79%)—Buy signal effective 11/21/2023.
All linked charts above are courtesy of Bloomberg via ZeroHedge.
———————————————————-
WOULD YOU LIKE TO HAVE YOUR INVESTMENTS PROFESSIONALLY MANAGED?
Do you have the time to follow our investment plans yourself? If you are a busy professional who would like to have his portfolio managed using our methodology, please contact me directly to get more details.
—————————————————————-
Contact Ulli