

- Moving the markets
The Dow took a nosedive today, leading the market’s merry dance downwards as interest rates inched up and traders sifted through the latest earnings reports like kids at a candy store. Investors are on the edge of their seats, waiting for more data to peek into the wallet of the American consumer.
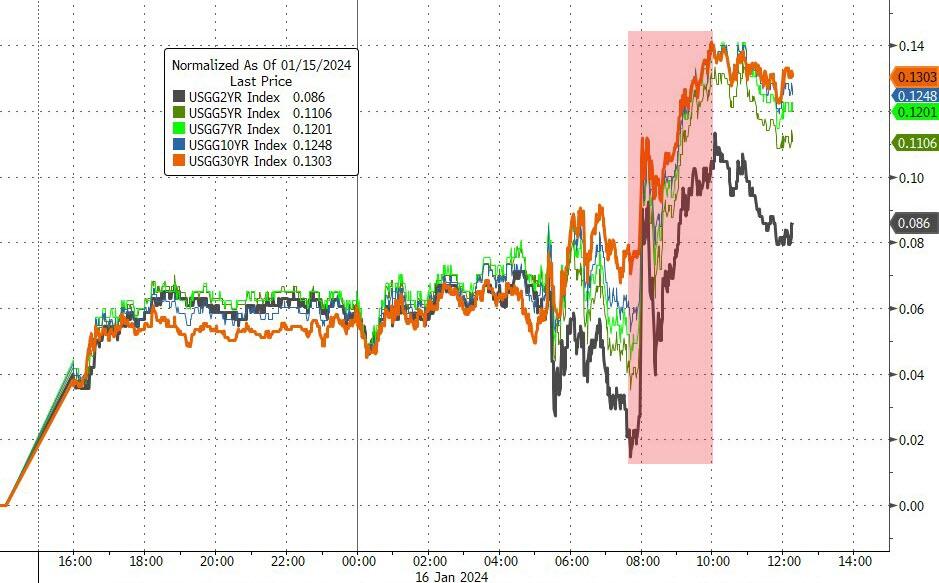
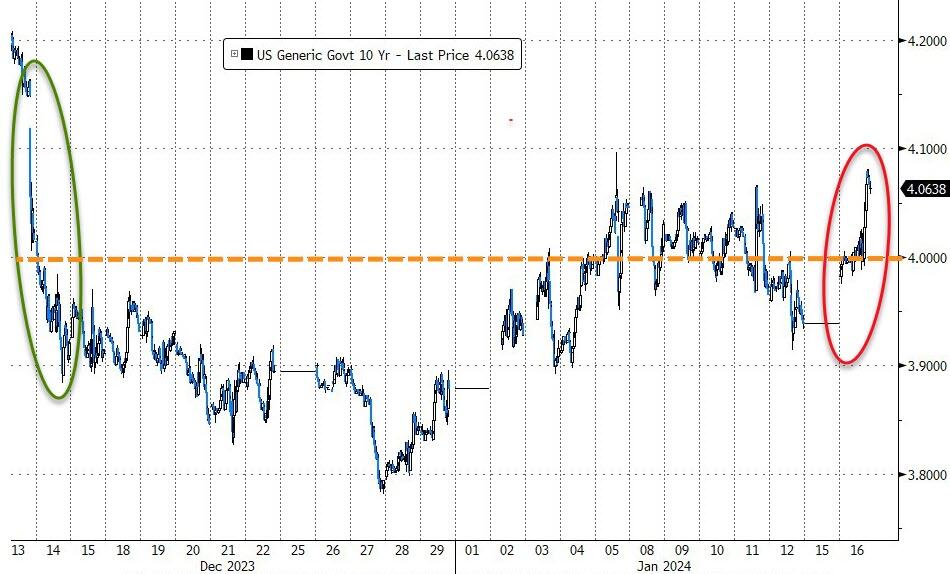
The 10-year Treasury note yield leaped like a frog, up 12 basis points to 4.071%, after Federal Reserve Governor Christopher Waller played coy in his speech, hinting that the Fed’s monetary policy might loosen up slower than a snail at a marathon, much to Wall Street’s chagrin.
Waller’s words were a juggling act of optimism and caution:
“I’m getting that warm, fuzzy feeling that we’re almost hugging that sustainable 2% PCE inflation.”
“As long as inflation doesn’t get clingy, I’m hopeful the FOMC will cut the federal funds rate target range this year.”
“When it’s time to trim rates, let’s do it with the precision of a bonsai artist.”
“With the economy flexing and inflation on a gentle descent to 2%, there’s no rush to slash rates like a Black Friday sale.”
“I’m pretty sure we’ve nailed the policy setting.”
Traders, expecting a different tune, watched their rate-cut dreams crumble like a cookie. Equities took a dive, bond yields soared, and the message was loud and clear: those six rate cuts we were daydreaming about? Might want to pinch yourself. And a March cut? Don’t bet your bottom dollar.
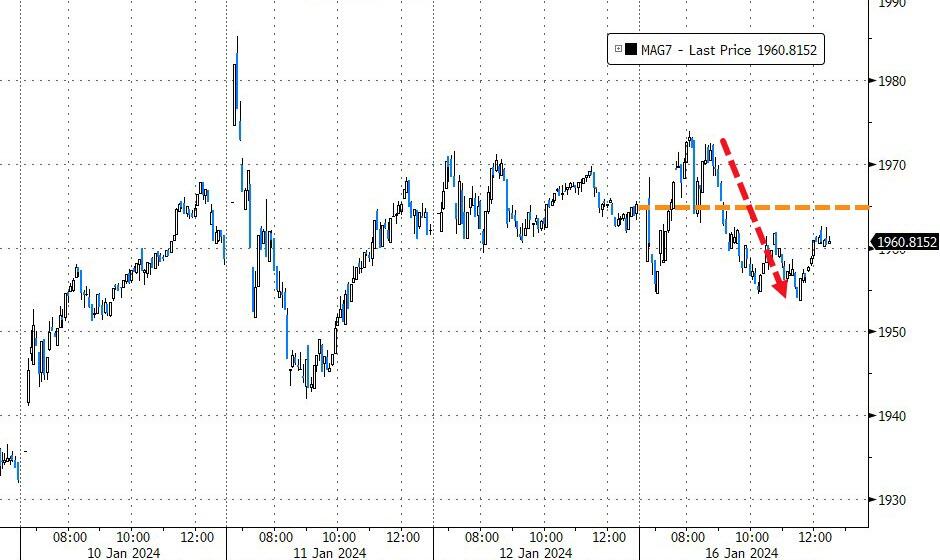
The 10-year yield strutted back above 4% and closed at its loftiest since the December Fed meeting, as financial conditions loosened up. The MAG7 stocks stood their ground, but the most shorted gave their investors some nice gains.
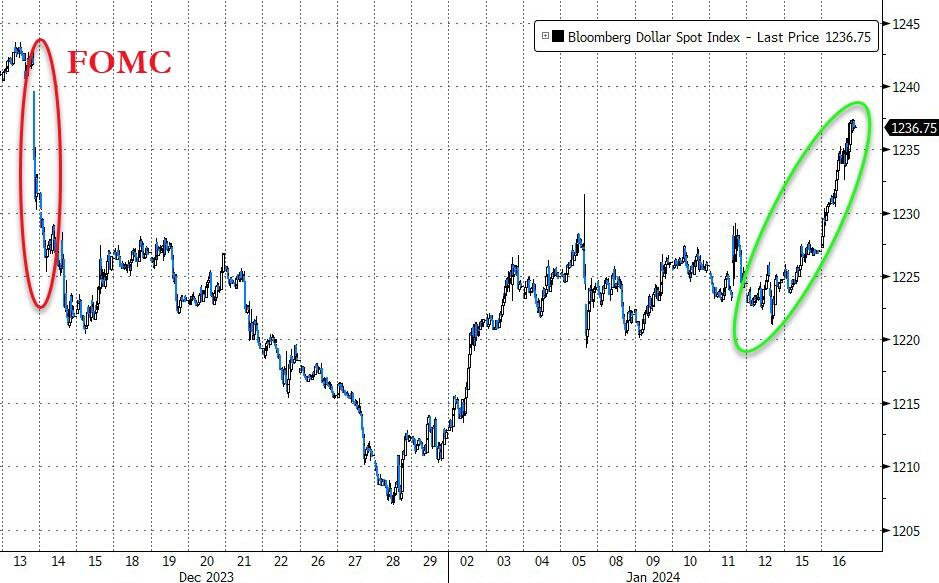
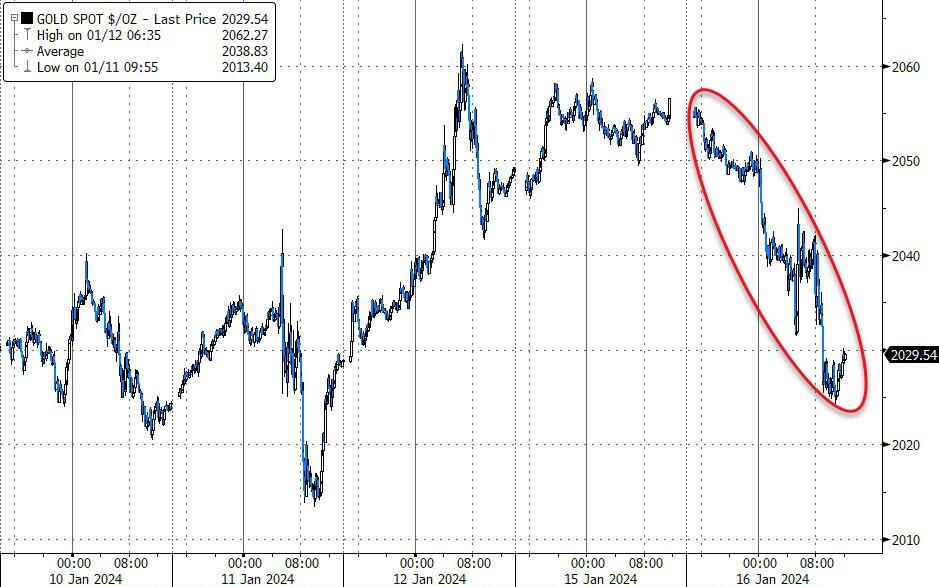
The dollar, riding the high-yield wave, broke free from its trading shackles, while gold took a tumble yet clung to its $2k throne.
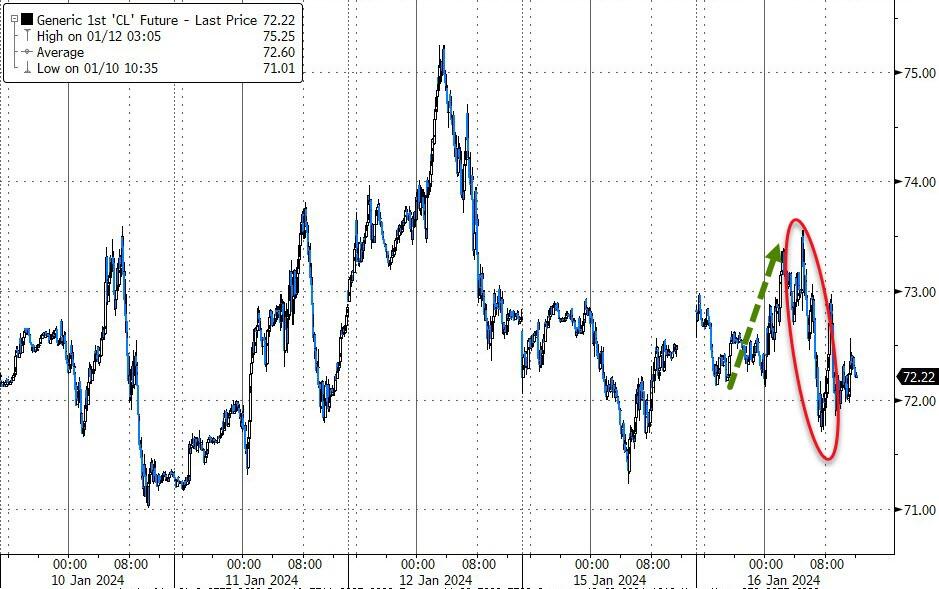
Amidst the growing drumbeats of war in the Middle East, crude oil played hopscotch before bowing out lower. But don’t hold your breath; this calm might just be the eye of the storm.
Will the market’s rollercoaster ride smooth out, or are we in for more loop-the-loops?
2. Current “Buy” Cycles (effective 11/21/2023)
Our Trend Tracking Indexes (TTIs) have both crossed their trend lines with enough strength to trigger new “Buy” signals. That means, Tuesday, 11/21/2023, was the official date for these signals.
If you want to follow our strategy, you should first decide how much you want to invest based on your risk tolerance (percentage of allocation). Then, you should check my Thursday StatSheet and Saturday’s “ETFs on the Cutline” report for suitable ETFs to buy.
3. Trend Tracking Indexes (TTIs)
During the trading session, Wall Street saw a predominance of declines, resulting in a moderate drop in the major indices by the close. The Dow Jones Industrial Average was particularly affected, suffering significant losses due to a downgrade of Boeing’s stock and a subsequent fall in its price.
Meanwhile, our Trend Tracking Indexes (TTIs) also experienced a slight decrease, yet they continue to hold well above their long-term trend lines, indicating overall stability.
This is how we closed 1/16/2024:
Domestic TTI: +6.14% above its M/A (prior close +6.82%)—Buy signal effective 11/21/2023.
International TTI: +5.32% above its M/A (prior close +6.44%)—Buy signal effective 11/21/2023.
All linked charts above are courtesy of Bloomberg via ZeroHedge.
———————————————————-
WOULD YOU LIKE TO HAVE YOUR INVESTMENTS PROFESSIONALLY MANAGED?
Do you have the time to follow our investment plans yourself? If you are a busy professional who would like to have his portfolio managed using our methodology, please contact me directly to get more details.
—————————————————————-
Contact Ulli