
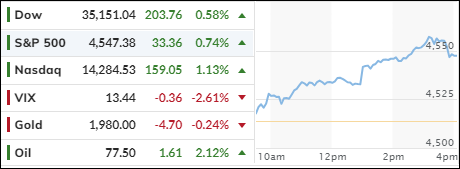
[Chart courtesy of MarketWatch.com]
- Moving the markets
The U.S. stock market continued its bullish run as it entered the Thanksgiving week, which will have a shorter trading schedule.
Traders are feeling optimistic after the latest inflation data showed a lower-than-expected increase in consumer prices, easing the fears of a prolonged period of high inflation and aggressive rate hikes by the Federal Reserve. Some analysts even expect the Fed to start cutting rates sooner than later, which could boost the market further.
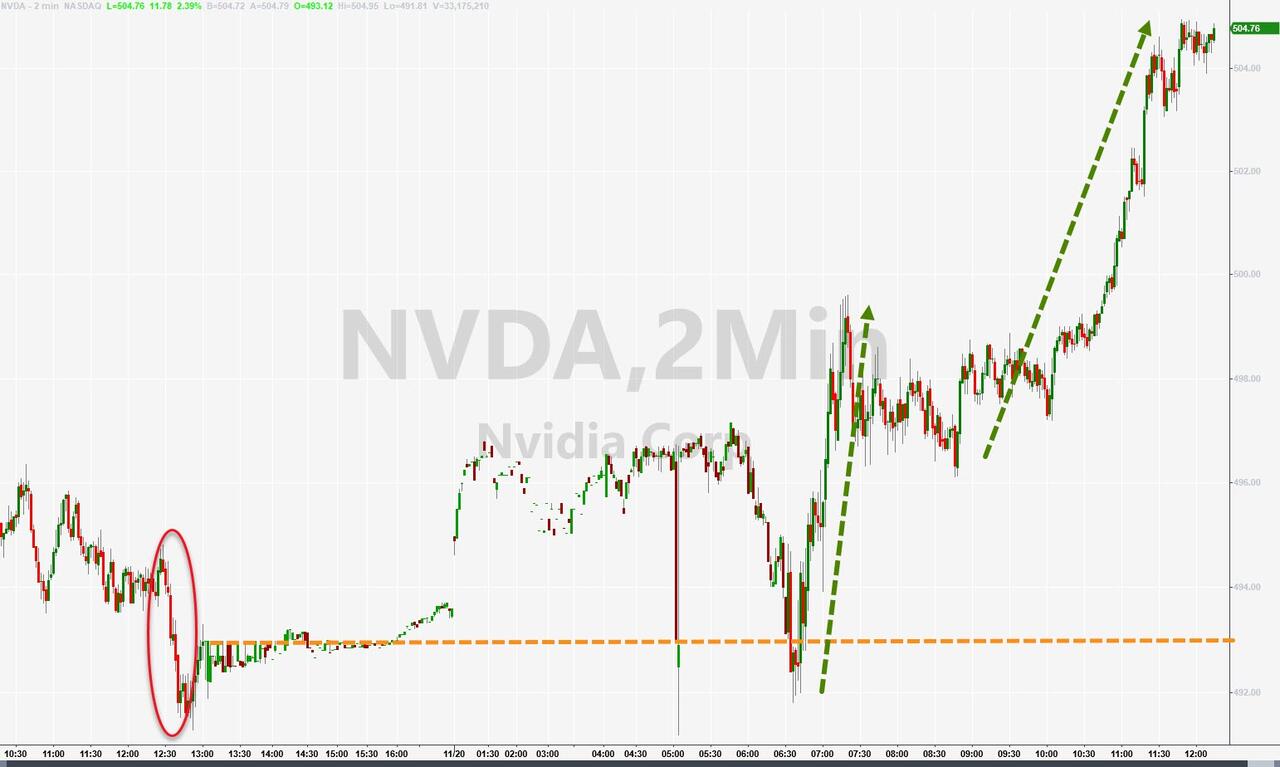
Among the notable earnings reports this week, Nvidia stands out as the star performer of the year, with its stock price soaring more than 200% in 2023. The chipmaker will announce its third-quarter results on Tuesday, and investors are eager to see if it can maintain its momentum amid the global chip shortage and rising competition.
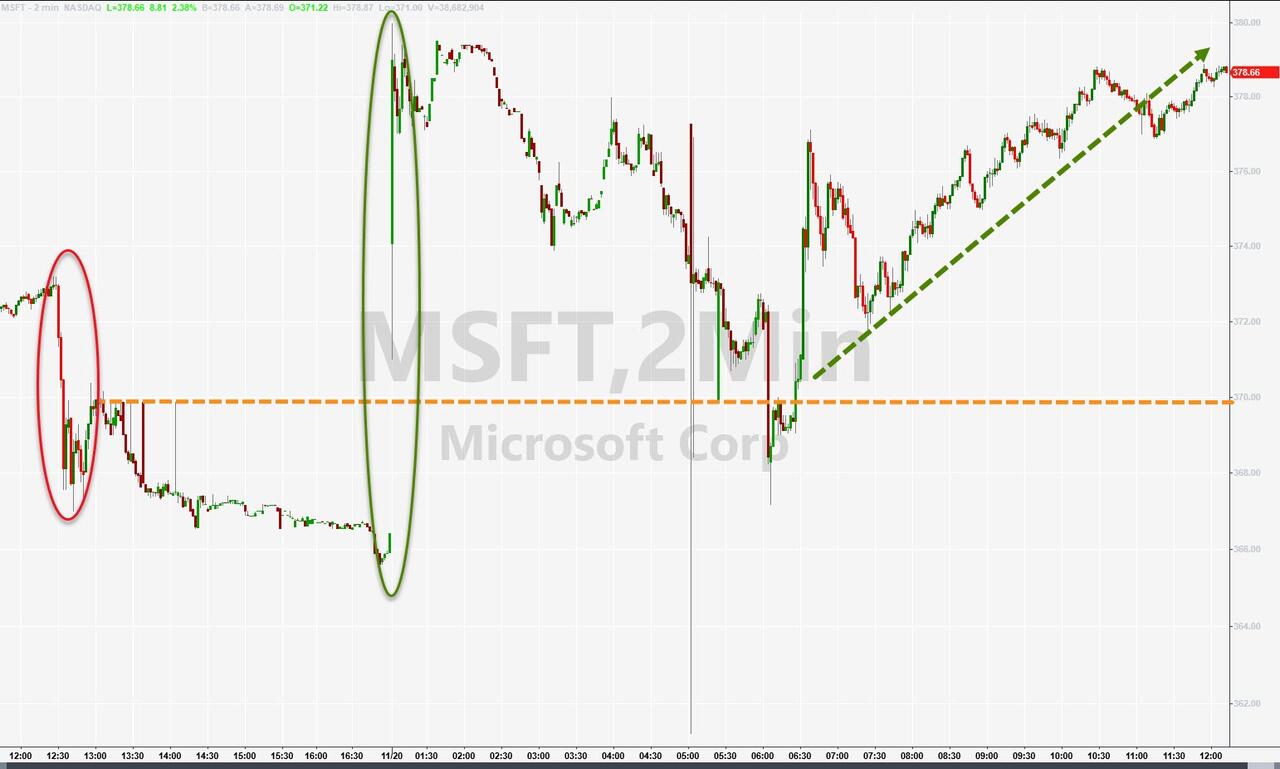
Meanwhile, the tech sector also got a boost from the drama surrounding OpenAI, the artificial intelligence research organization that was co-founded by Elon Musk. Several of its top researchers threatened to leave the organization and join Microsoft, which has a close partnership with OpenAI. This news sent Microsoft’s stock to a new record high, while Nvidia also benefited from its involvement in OpenAI’s projects.
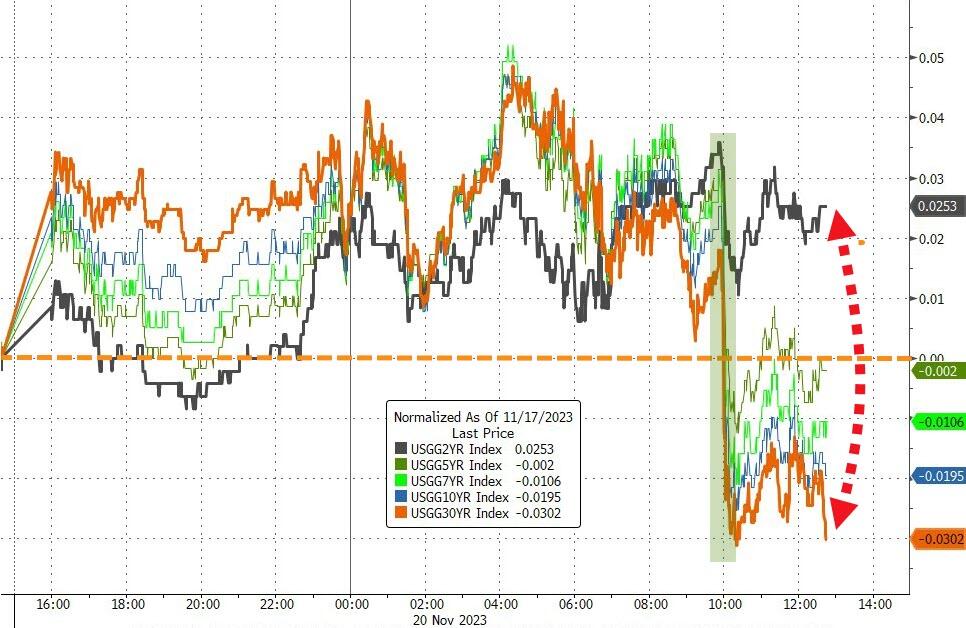
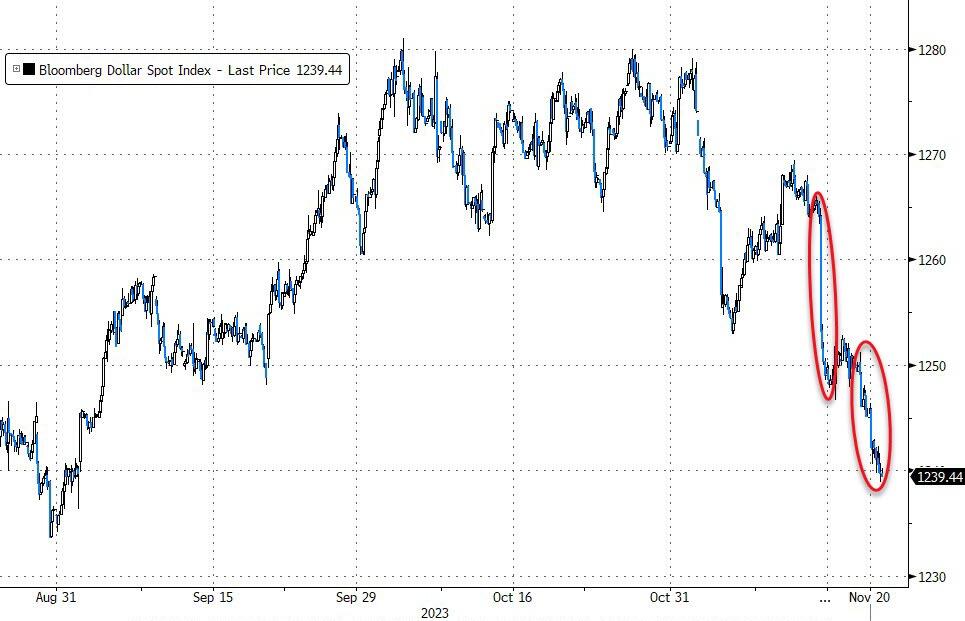
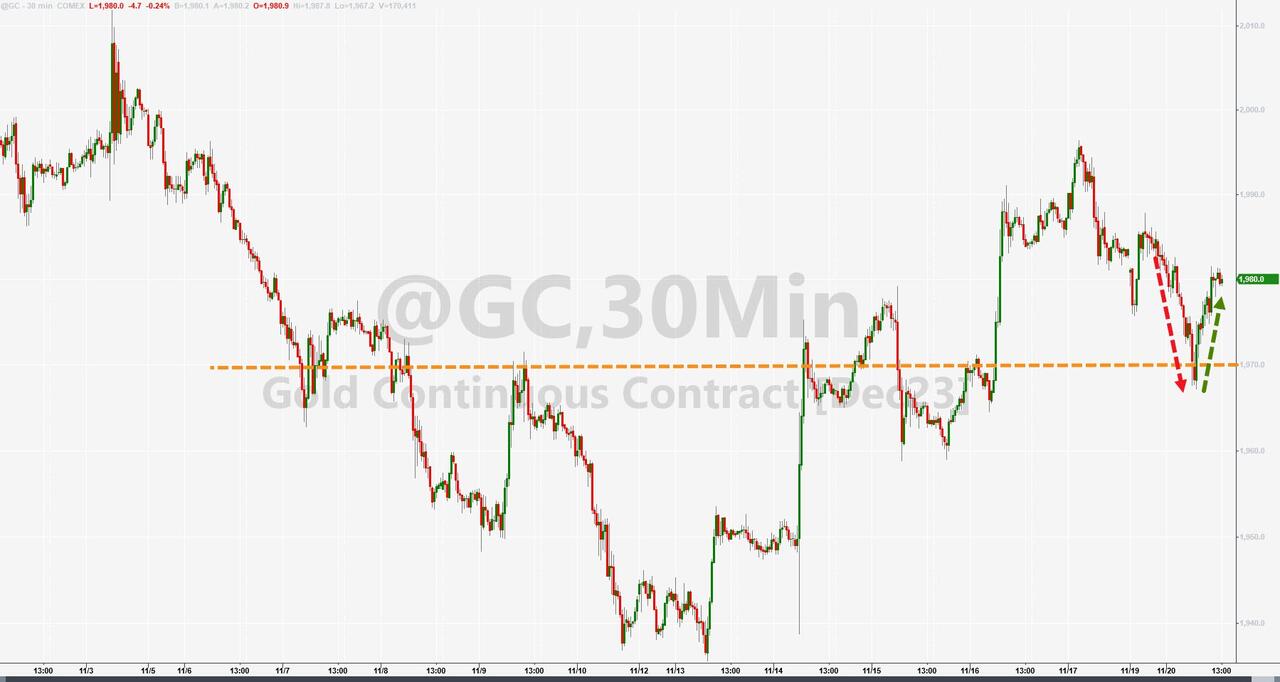
On the other hand, the bond market saw a strong demand for the 20-year Treasury auction, which pushed the yields lower and supported the stock rally. However, the rally lost some steam towards the end of the day, as some traders took profits ahead of the holiday. The U.S. dollar also weakened to its lowest level since late August, breaking below its 200-day moving average. However, this did not help gold, which remained flat and slightly lower.
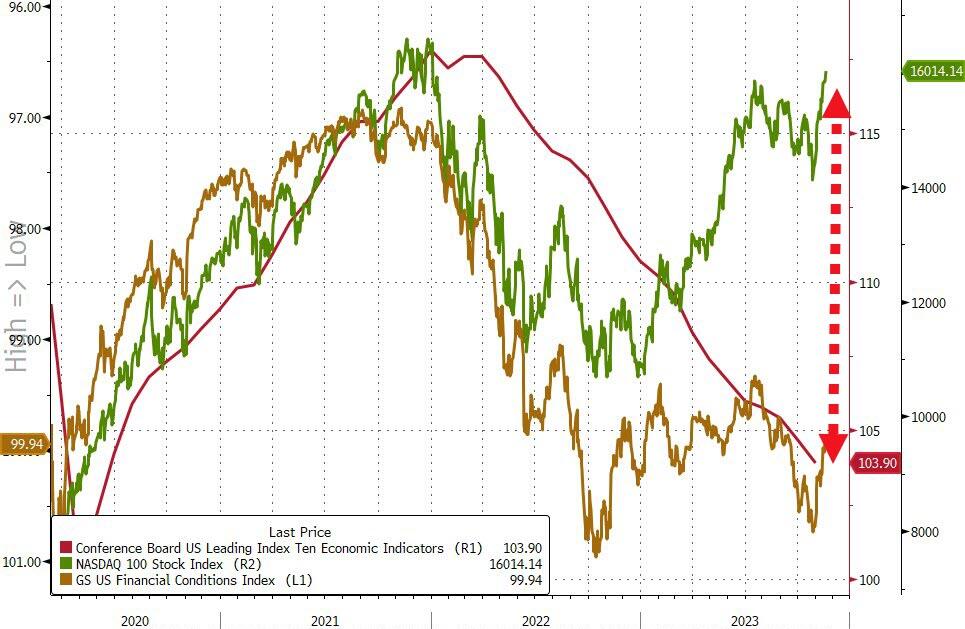
Despite the bullish sentiment in November, there is still a glaring discrepancy between the financial conditions index, which measures the tightness of credit and liquidity in the market, the leading indicators, which predict the future economic activity, and the Nasdaq, which is hovering near its all-time high. This divergence suggests that the market may be overvalued and disconnected from the underlying fundamentals.
Can the market sustain its rally in the face of these challenges?
2. Current “Buy” Cycles (effective 11/21/2023)
Our Trend Tracking Indexes (TTIs) continued to rise after last week’s gains. They both crossed their trend lines with enough strength to trigger “Buy” signals. We will use tomorrow, Tuesday, 11/21/2023, as the official date for these signals.
If you want to follow our strategy, you should first decide how much you want to invest based on your risk tolerance (percentage of allocation). Then, you should check my Thursday StatSheet and Saturday’s “ETFs on the Cutline” report for suitable ETFs to buy.
3. Trend Tracking Indexes (TTIs)
The major indexes kept up their upward trend from last week. Our TTIs confirmed that a new “Buy” signal was activated, starting from tomorrow.
This is how we closed 11/20/2023:
Domestic TTI: +1.38% above its M/A (prior close +0.98%)—Buy signal effective 11/21/2023.
International TTI: +3.36% above its M/A (prior close +2.83%)—Buy signal effective 11/21/2023.
All linked charts above are courtesy of Bloomberg via ZeroHedge.
Contact Ulli