- Moving the markets
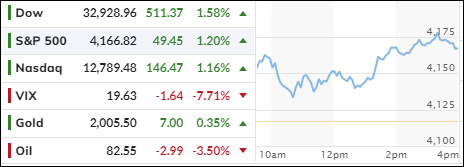
Stocks bounced back on Monday after a brutal beating in the past few weeks. The S&P 500 tried to escape the correction zone, as traders braced for a busy week of Fed, jobs, and Apple news.
It was about time for some relief from the oversold madness. The rally was widespread, with all 11 sectors of the S&P 500 in the green. Tech, consumer, and communication stocks led the way. Big tech giants like Amazon and Meta Platforms gained more than 2% each.
The rebound followed a dismal week for the S&P 500, which dropped 2.5% and more than 10% from its 2023 peak. It’s down 3% for October, heading for its worst three-month streak since the pandemic hit in 2020.
The Fed will announce its rate decision on Wednesday, and most traders expect no change. With soaring interest rates blamed for the market slump, traders hope the Fed will hint at a pause in rate hikes and keep the Santa Claus rally alive.
The 10-year Treasury yield spiked above 5% last week but eased to around 4.9% on Monday.
The October jobs report will come out on Friday, and investors hope for some cooling in the labor market that will make the Fed more relaxed. Apple will release its earnings on Thursday after the market closes. The largest stock in the S&P 500 is also in a correction, down 15% from its record high.
In the end, traders were glad that WW3 didn’t erupt over the weekend, which boosted their mood. Financial stocks did well, with the KBW Bank index recovering from Friday’s losses. Tesla missed out on the party due to worries about battery supply. Despite some help from short squeezers, most shorted stocks ended flat, as they ran out of steam.
Looking at the big picture, ZeroHedge noted that without the Mag 7 stocks, most equity indices are below their 200-week averages and negative for the year, as this chart shows. Ouch indeed.
Bond yields rose slightly, with the 30-year bouncing off its 5% level twice. The dollar weakened, gold fell from its highs but stayed above $2k, and crude oil plunged 4%.
Financial conditions keep getting tighter, which makes me wonder: how much will this hurt the economy, and when will we feel it?
2. “Buy” Cycle (12/1/22 to 9/21/2023)
The current Domestic Buy cycle began on December 1, 2022, and concluded on September 21, 2023, at which time we liquidated our holdings in “broadly diversified domestic ETFs and mutual funds”.
Our International TTI has now dipped firmly below its long-term trend line, thereby signaling the end of its current Buy cycle effective 10/3/23.
We have kept some selected sector funds. To make informed investment decisions based on your risk tolerance, you can refer to my Thursday StatSheet and Saturday’s “ETFs on the Cutline” report.
Considering the current turbulent times, it is prudent for conservative investors to remain in money market funds—not bond funds—on the sidelines.
3. Trend Tracking Indexes (TTIs)
The major indexes recovered some of their losses after a steep decline over the last few weeks. But this does not mean that the downtrend is over. We need to see more positive signs before we turn bullish again.
Our TTIs rose but are still far below their trend lines. These lines show us whether the market is in a bullish or bearish phase.
This is how we closed 10/30/2023:
Domestic TTI: -6.85% below its M/A (prior close -7.58%)—Sell signal effective 9/22/2023.
International TTI: -3.60% below its M/A (prior close -4.33%)—Sell signal effective 10/3/2023.
All linked charts above are courtesy of Bloomberg via ZeroHedge.
Contact Ulli