
- Moving the markets
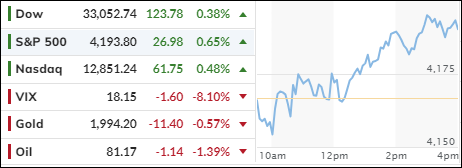
The S&P 500 managed to end the day in the green, but it was not enough to save the month from being a disaster.
Treasury yields soared to levels not seen since 2007, making bonds look more attractive than stocks.
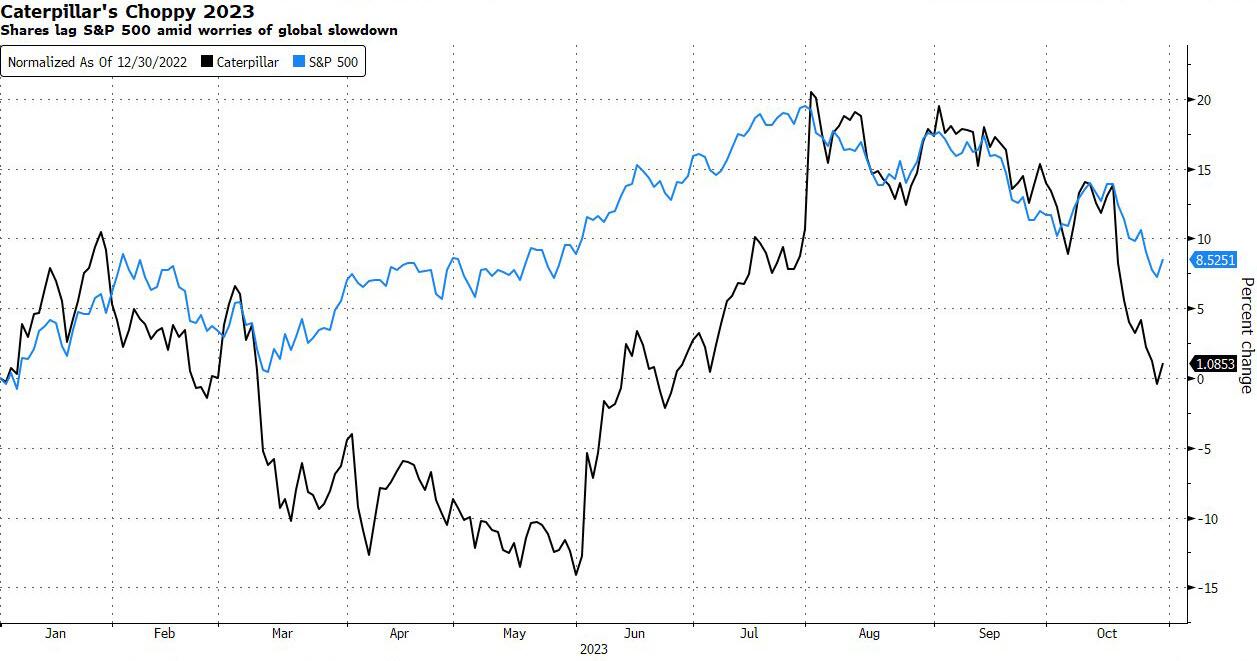
Caterpillar, the maker of heavy machinery, beat earnings expectations for the third quarter, but warned that its fourth-quarter revenue would be only slightly better than last year. Investors were not impressed and dumped the stock, sending it down more than 5%.
The major indexes suffered their third consecutive monthly loss, something that has not happened since the pandemic hit in March 2020. The Dow and the S&P 500 lost about 2.2% and 3%, respectively, while the Nasdaq dropped more than 3%.
The tech sector was hit hard by rising interest rates, which hurt the valuations of growth stocks. But the biggest loser of the month was the Small Caps index, which plunged over 7% in October, marking its third straight negative month and its worst performance since September 2022.
Wall Street is now waiting for the Fed to announce its interest rate decision on Wednesday. The market is almost certain that the Fed will keep rates unchanged, but it is also looking for clues about its future plans. Will they hint at more rate hikes, or will they be more cautious?
Traders are also hoping for some good news from the October payrolls report, which will be released on Friday. They hope that the labor market will show some signs of cooling down, which could ease the pressure on the Fed to tighten monetary policy. But is that wishful thinking?
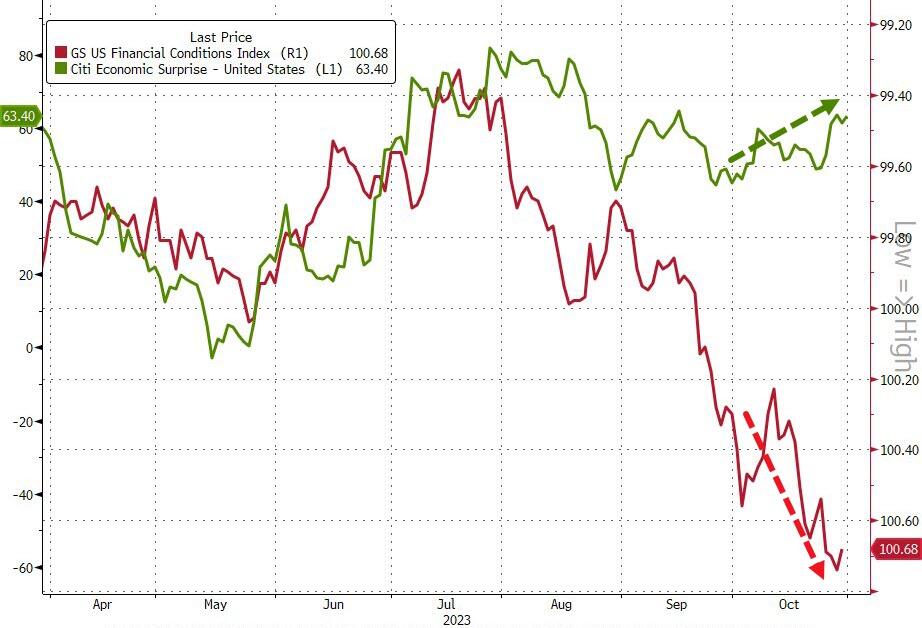
ZeroHedge summed up the latest data points like this:
- Today saw wage inflation rising faster than hoped (hawkish for Fed) and consumer confidence worsened (with inflation expectations jumping).
- Not exactly a great way to end the month.
- But, as Financial Conditions tightened for the 3rd straight month in October, they failed to spook the economy…
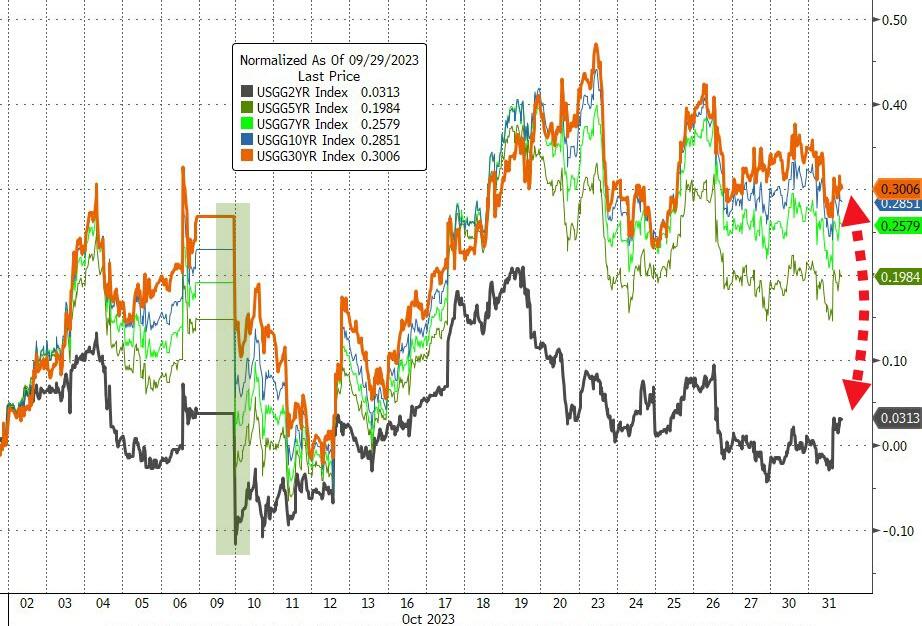
Bond yields moved in different directions in October, with the long bond rising over 30 basis points, but the short bond staying flat.
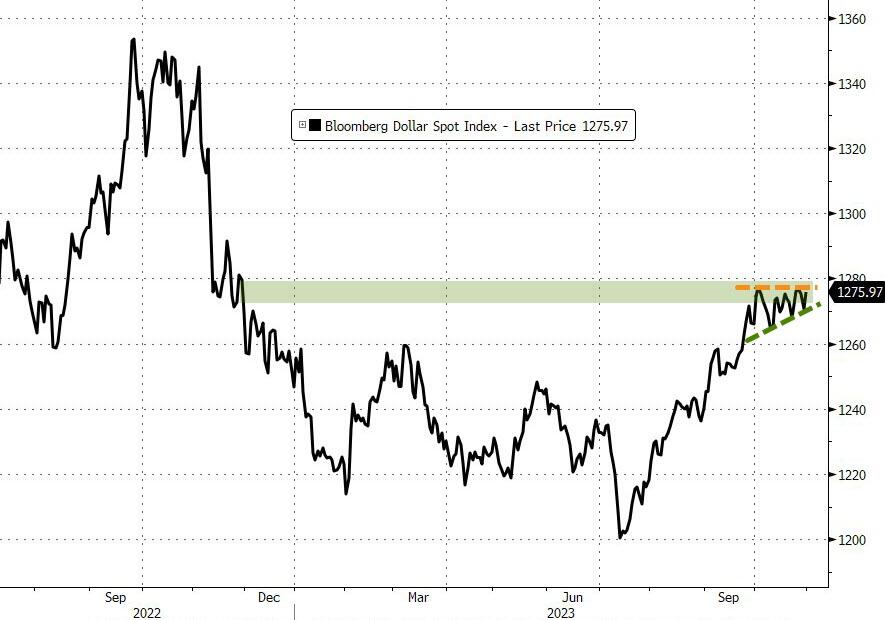
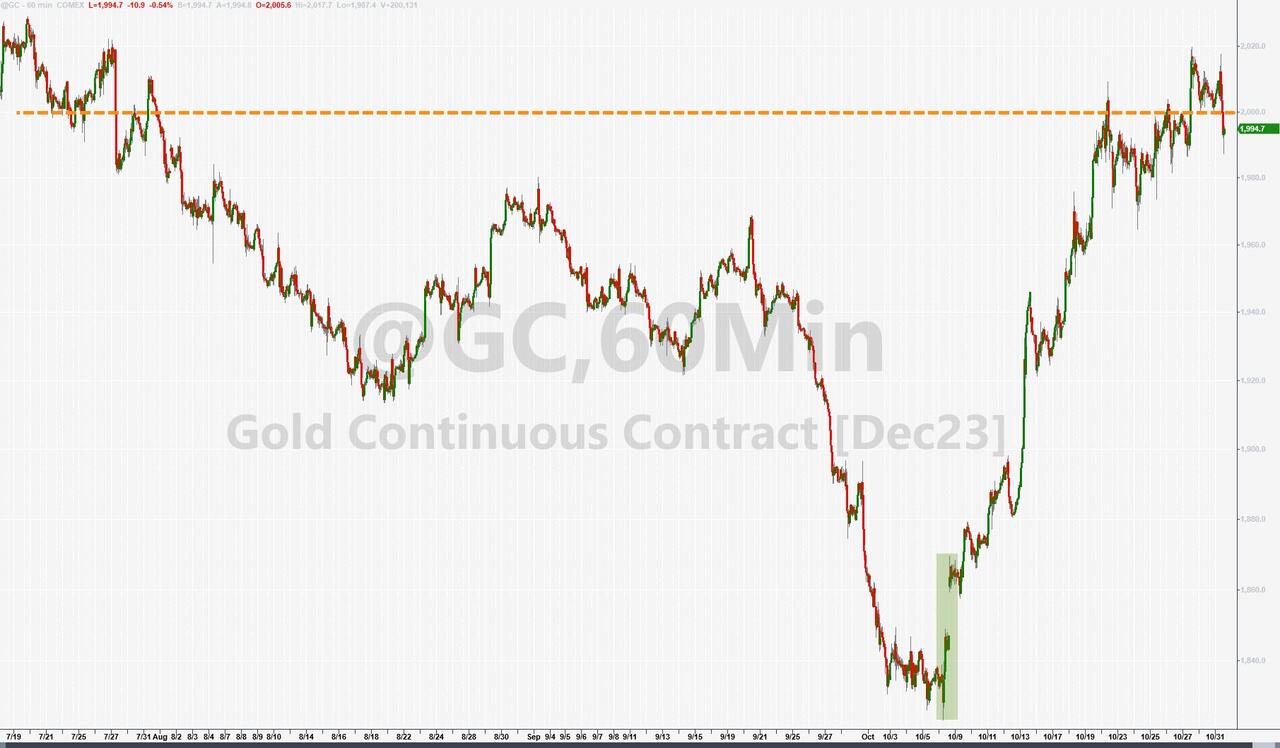
The dollar gained strength for the third month in a row, thanks to higher bond yields. Gold had its best month since March, but it failed to stay above its $2k level and slipped slightly today.
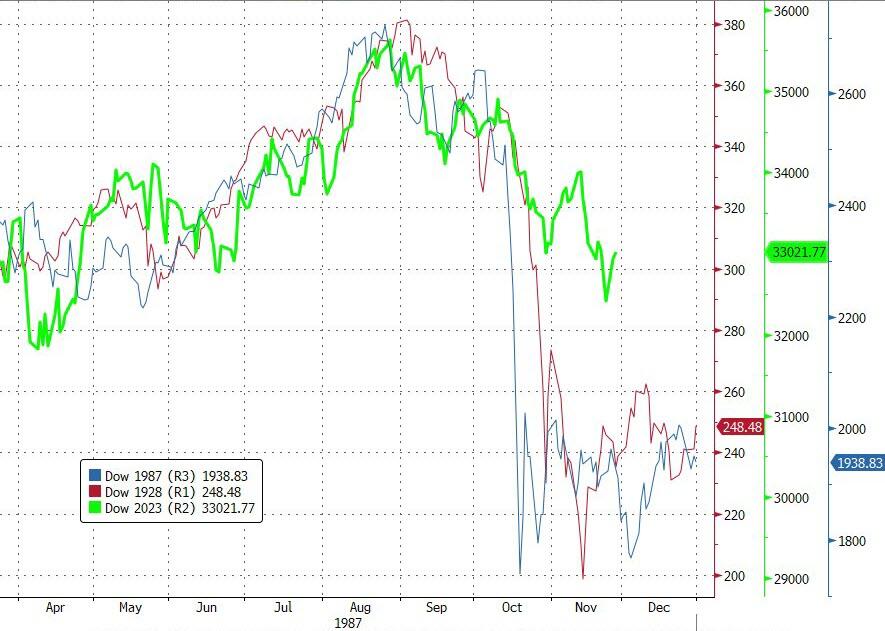
The markets are still overpriced compared to GDP and history is not on their side. This chart shows how the current level of the 1923 Dow compares to its 1987 and 1928 performance.
Are we heading for another crash?
2. “Buy” Cycle (12/1/22 to 9/21/2023)
The current Domestic Buy cycle began on December 1, 2022, and concluded on September 21, 2023, at which time we liquidated our holdings in “broadly diversified domestic ETFs and mutual funds”.
Our International TTI has now dipped firmly below its long-term trend line, thereby signaling the end of its current Buy cycle effective 10/3/23.
We have kept some selected sector funds. To make informed investment decisions based on your risk tolerance, you can refer to my Thursday StatSheet and Saturday’s “ETFs on the Cutline” report.
Considering the current turbulent times, it is prudent for conservative investors to remain in money market funds—not bond funds—on the sidelines.
3. Trend Tracking Indexes (TTIs)
The major indexes recovered some of their losses after a weak opening, but the rebound was slow yet steady.
Our Trend Tracking Indexes (TTIs) also rose slightly, but they are still below their moving averages. The market needs a stronger rally to turn from bearish to bullish.
This is how we closed 10/31/2023:
Domestic TTI: -6.08% below its M/A (prior close -6.85%)—Sell signal effective 9/22/2023.
International TTI: -3.52% below its M/A (prior close -3.60%)—Sell signal effective 10/3/2023.
All linked charts above are courtesy of Bloomberg via ZeroHedge.
Contact Ulli