
- Moving the markets
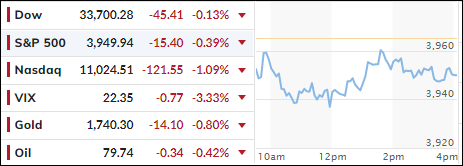
The major indexes shed some more of their recent gains during this first day of a Holiday shortened trading week. Not helping the already jittery market were reports of China possibly ramping up Covid restrictions due to some additional deaths and the lockdowns spreading.
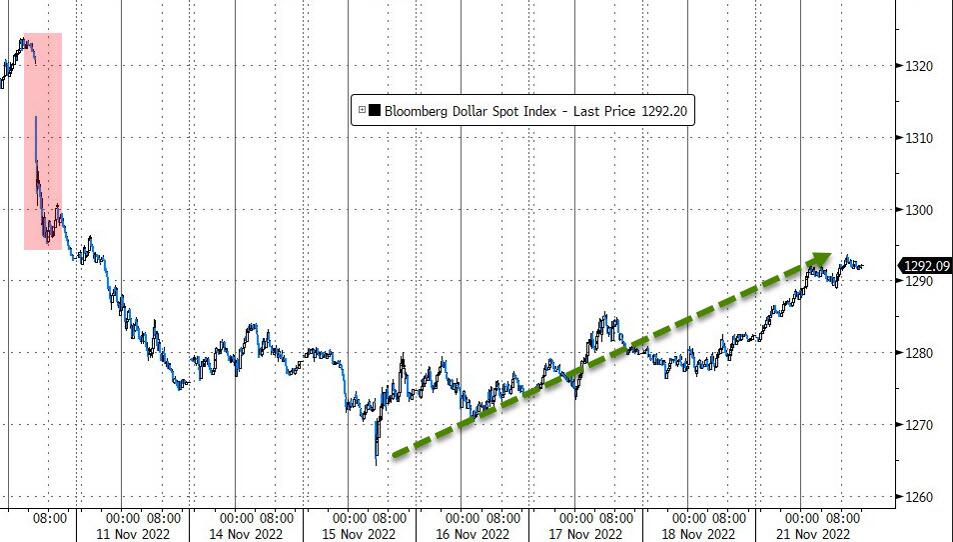
As a result, the Chinese Yuan plunged, and the US Dollar continued its 4-day uptrend.
That means the much hoped for reopening may not pan out as planned, thereby putting the discussion of a global economic recovery back on the front burner. Still, the recent bear market bounce may find some support in the form of reduced trading this week, as traders take time off, which can increase volatility due to lower volume.
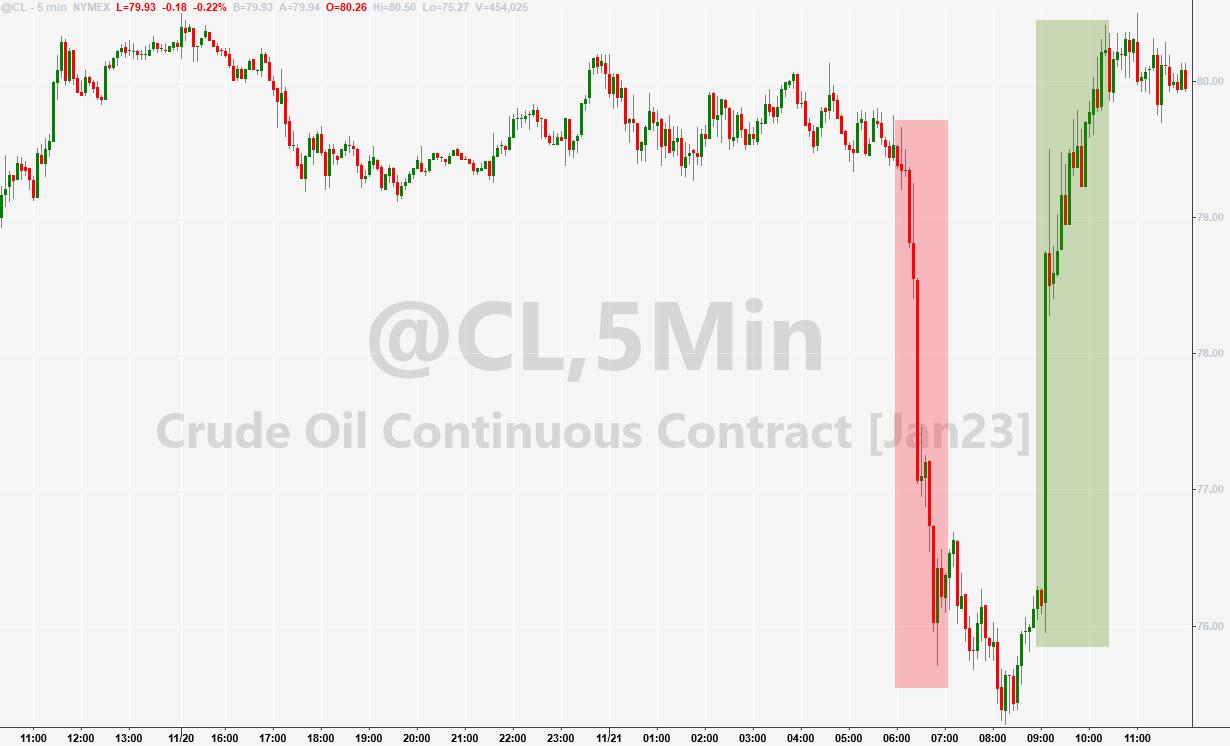
If there are no market news, rumors can give an assist. This was the case today, when speculation surfaced that OPEC+ was considering production hikes causing Crude Oil to tank, shortly after which the denial was published, which then created this silly chart.
The most shorted stocks continued their unwind process from the post-CPI squeeze, as ZeroHedge put it, which again tells me the importance a short squeeze has when to comes to creating or sustaining bullish momentum.
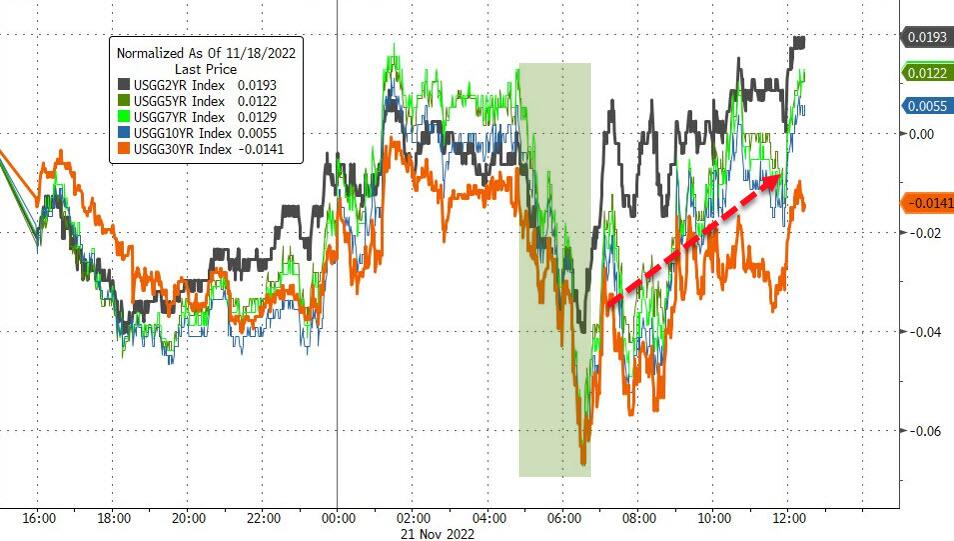
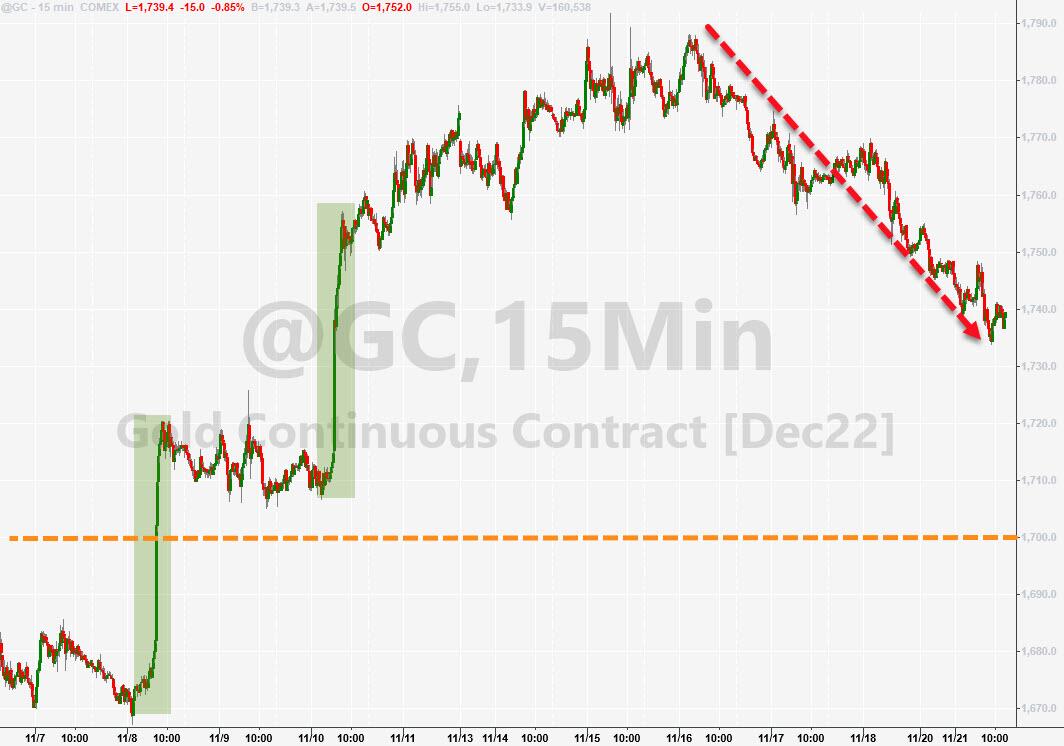
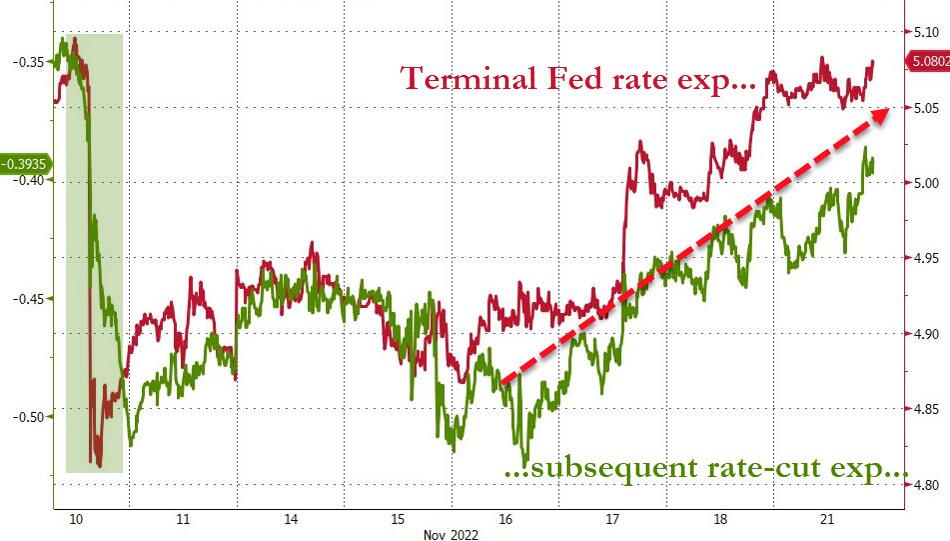
Bond yields went predominantly sideways, gold faded, and the Fed’s Terminal Expectation rate moved back to its cycle highs above the 5.08% mark. Again, the much hoped for pause or pivot (to lower rates) is nowhere to be seen.
2. ETFs in the Spotlight
In case you missed the announcement and description of this section, you can read it here again.
It features some of the 10 broadly diversified domestic and sector ETFs from my HighVolume list as posted every Saturday. Furthermore, they are screened for the lowest MaxDD% number meaning they have been showing better resistance to temporary sell offs than all others over the past year.
The below table simply demonstrates the magnitude with which these ETFs are fluctuating above or below their respective individual trend lines (%+/-M/A). A break below, represented by a negative number, shows weakness, while a break above, represented by a positive percentage, shows strength.
For hundreds of ETF choices, be sure to reference Thursday’s StatSheet.
For this closed-out domestic “Buy” cycle (2/24/2022), here’s how some of our candidates have fared. Keep in mind that our Domestic Trend Tracking Index (TTI) signaled a “Sell” on that date, which overrode the existing “Buys” shown for SPY and IYM:
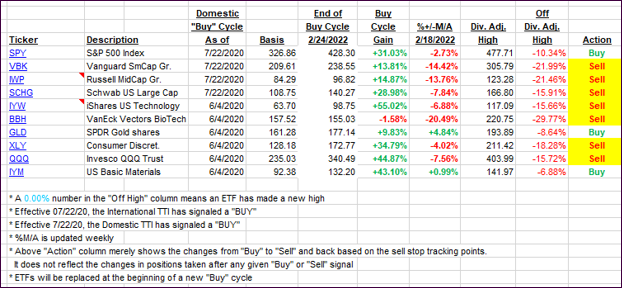
Click image to enlarge.
Again, the %+/-M/A column above shows the position of the various ETFs in relation to their respective long-term trend lines, while the trailing sell stops are being tracked in the “Off High” column. The “Action” column will signal a “Sell” once the -12% point has been taken out in the “Off High” column, which has replaced the prior -8% to -10% limits.
3. Trend Tracking Indexes (TTIs)
Our TTIs barely changed, as the markets snaked sideways.
This is how we closed 11/21/2022:
Domestic TTI: +1.02% above its M/A (prior close +1.06%)—Sell signal effective 02/24/2022.
International TTI: -0.27% below its M/A (prior close -0.34%)—Sell signal effective 03/08/2022.
Disclosure: I am obliged to inform you that I, as well as my advisory clients, own some of the ETFs listed in the above table. Furthermore, they do not represent a specific investment recommendation for you, they merely show which ETFs from the universe I track are falling within the specified guidelines.
All linked charts above are courtesy of Bloomberg via ZeroHedge.
Contact Ulli