
- Moving the markets
As I mentioned yesterday, with most traders being on vacation this week, reduced volume made it easier for the remaining crew to exuberantly push markets around and support the bullish cause. Looking towards the end of the year, hope that inflation might ease, and by association interest rates, was an underlying theme based more on wishful thinking than reality.
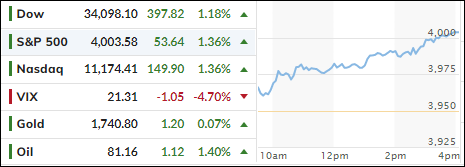
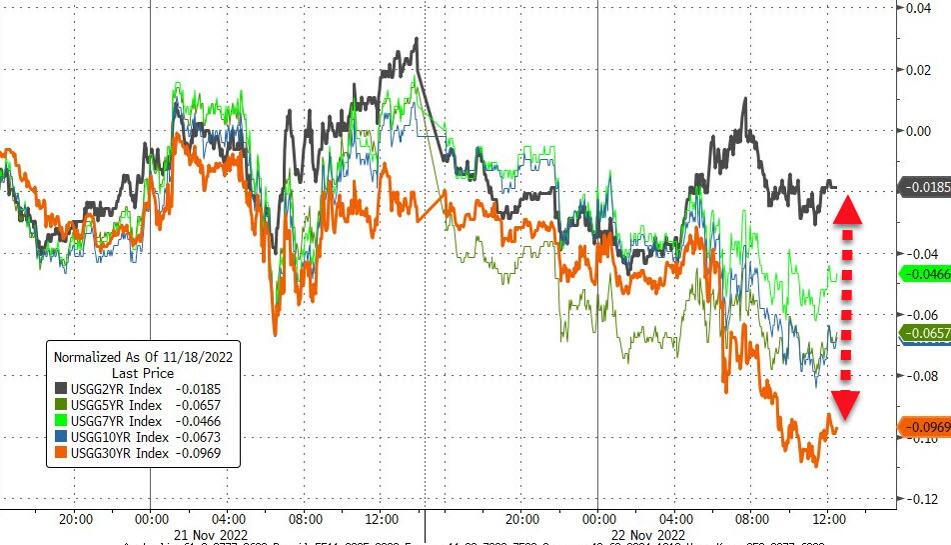
Helping matters was the Wall Street crowd’s focus on a host of strong earnings and their positive effect on stock prices (Best Buy +11%, Abercrombie & Fitch +19%, American Eagle Outfitters +16%), as well as easing bond yields with the 10-year slipping to 3.77%.
As ZeroHedge reported, today’s Fed mouth pieces had this to say:
- Mester: “Given the high level of inflation, restoring price stability remains the number one focus of the FOMC…monetary policy entering a different cadence.” Translation – we are hiking no matter what, but the pace of hikes may slow.
- George admits Fed buying MBS stoked surging home prices, adding that it “could well take a higher interest rate for some time to convince households to hold onto savings.” Translation – we are hiking rates more and holding for longer.
In other words, a pause or pivot is nowhere to be seen.
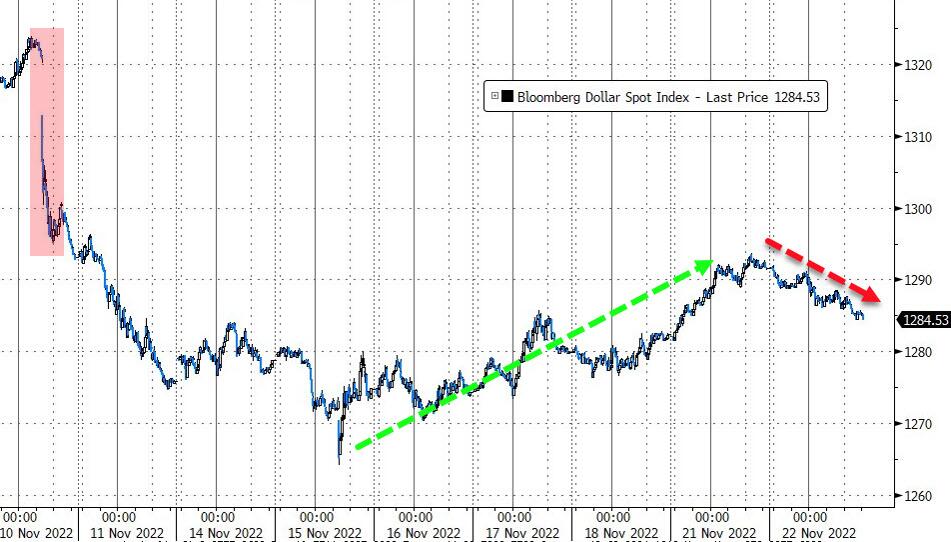
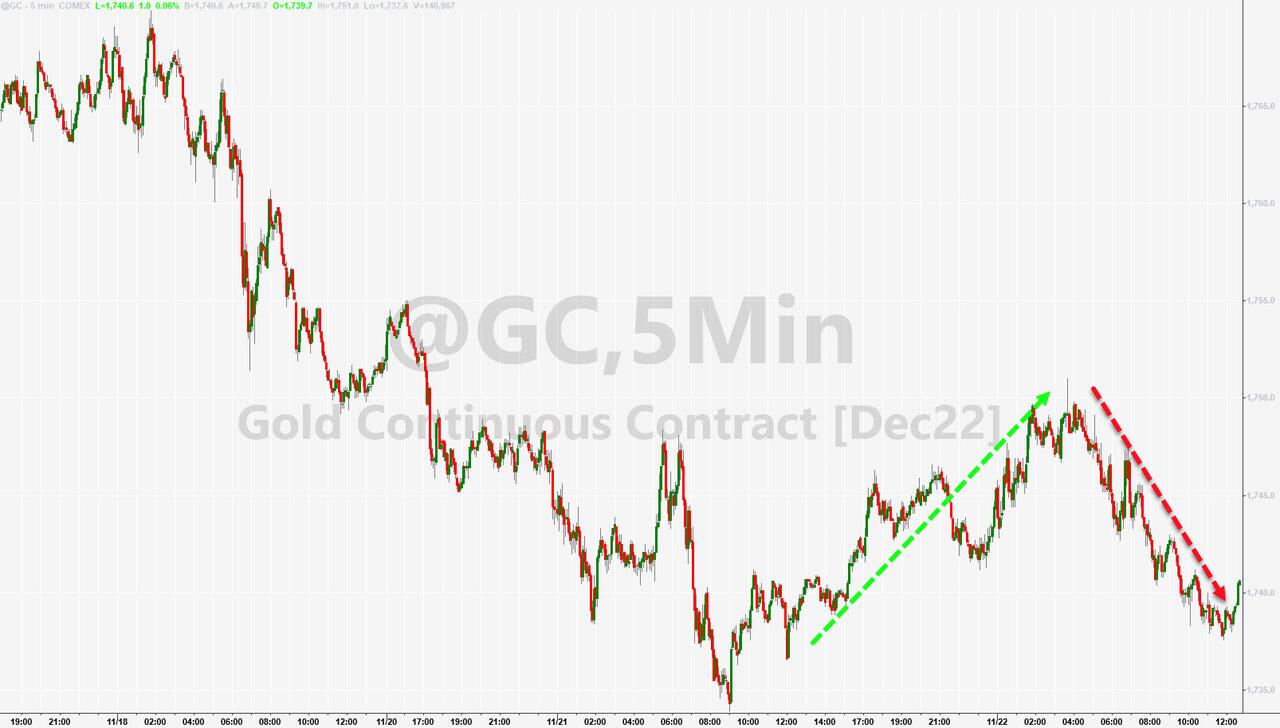
After gaining for four days, the US Dollar managed to slide, while Gold ended just about unchanged.
More earnings reports are on deck after the close today, along with econ data like initial jobless claims and PMI numbers. If there are no downside surprises, we might see today’s rebound get more support.
2. ETFs in the Spotlight
In case you missed the announcement and description of this section, you can read it here again.
It features some of the 10 broadly diversified domestic and sector ETFs from my HighVolume list as posted every Saturday. Furthermore, they are screened for the lowest MaxDD% number meaning they have been showing better resistance to temporary sell offs than all others over the past year.
The below table simply demonstrates the magnitude with which these ETFs are fluctuating above or below their respective individual trend lines (%+/-M/A). A break below, represented by a negative number, shows weakness, while a break above, represented by a positive percentage, shows strength.
For hundreds of ETF choices, be sure to reference Thursday’s StatSheet.
For this closed-out domestic “Buy” cycle (2/24/2022), here’s how some of our candidates have fared. Keep in mind that our Domestic Trend Tracking Index (TTI) signaled a “Sell” on that date, which overrode the existing “Buys” shown for SPY and IYM:

Click image to enlarge.
Again, the %+/-M/A column above shows the position of the various ETFs in relation to their respective long-term trend lines, while the trailing sell stops are being tracked in the “Off High” column. The “Action” column will signal a “Sell” once the -12% point has been taken out in the “Off High” column, which has replaced the prior -8% to -10% limits.
3. Trend Tracking Indexes (TTIs)
Our TTIs jumped higher with the Domestic one finally solidifying its position on the bullish side of its trend line. Next week, when traders return from their vacations, and the indexes maintain or even improve on current levels, I will issue a new “Buy” signal.
This is how we closed 11/22/2022:
Domestic TTI: +2.36% above its M/A (prior close +1.02%)—Sell signal effective 02/24/2022.
International TTI: +1.02% above its M/A (prior close -0.27%)—Sell signal effective 03/08/2022.
Disclosure: I am obliged to inform you that I, as well as my advisory clients, own some of the ETFs listed in the above table. Furthermore, they do not represent a specific investment recommendation for you, they merely show which ETFs from the universe I track are falling within the specified guidelines.
All linked charts above are courtesy of Bloomberg via ZeroHedge.
Contact Ulli