
- Moving the markets
It was another choppy session, as the release of the Fed’s meeting minutes (FOMC) showed a mixed picture in terms of future rates hikes. The Central Bank noted that it was seeing some progress in its inflation fighting efforts while stating that “a substantial majority of participants judged that a slowing in the pace of increase would likely soon be appropriate.”
That was the official statement, yet chairman Powell uttered these seemingly opposing words during the press conference:
“Okay. So, I would also say it’s premature to discuss pausing. It’s not something that we’re thinking about. That’s really not a conversation to be had now. We have a ways to go. The last thing I’ll say is that I would want people to understand our commitment to getting this done and to not making the mistake of not doing enough or the mistake of withdrawing our strong policy and doing that too soon. I control those messages. That’s my job.”
There you have it. Nothing in terms of pausing or pivoting was mentioned by him, but traders took it as a positive, with the major indexes scoring their second consecutive day of gains.
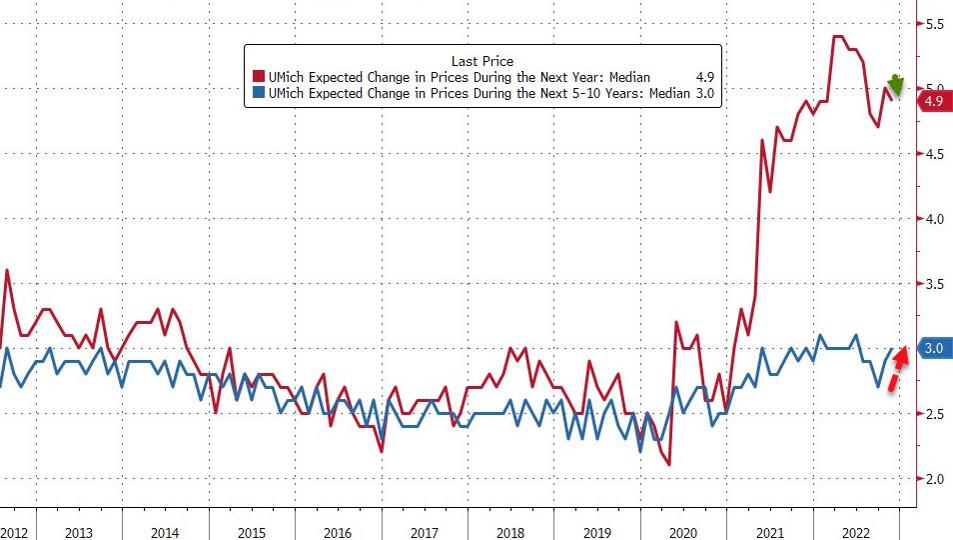
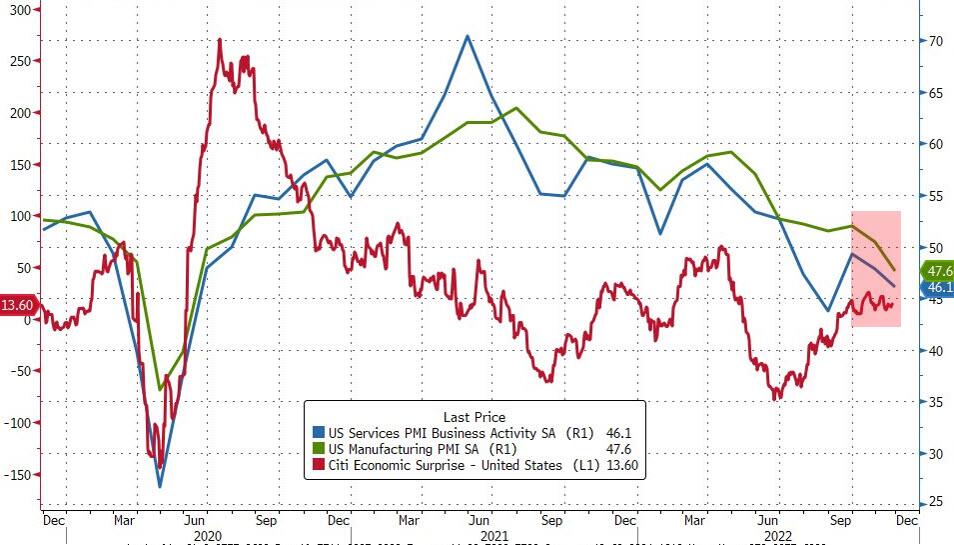
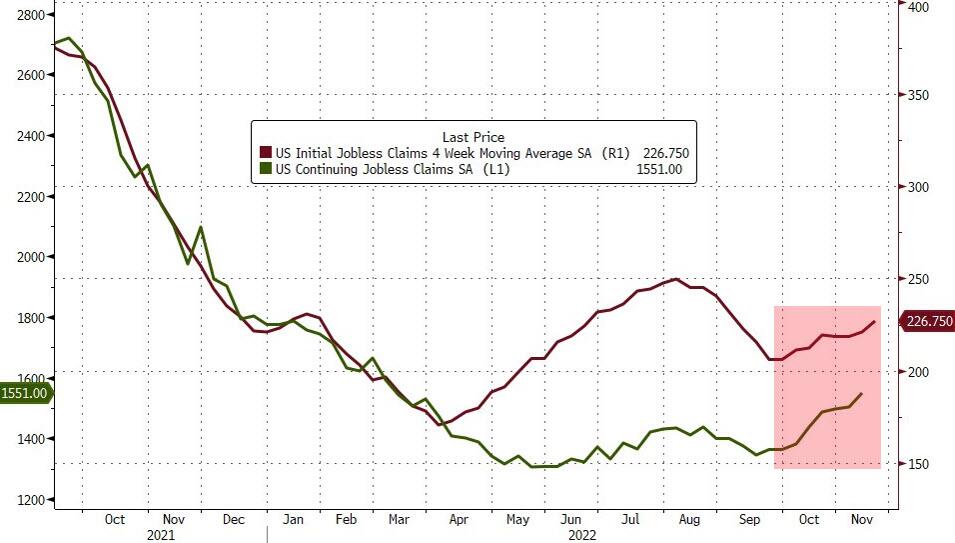
On the economic side, we learned that New Home Sales unexpectedly jumped, Americans’ inflation expectations dropped at tad, Manufacturing and Services plunged toward recession territory, and the Labor Market weakened with continuing jobless claims hitting an 8-month high, as ZeroHedge pointed out.
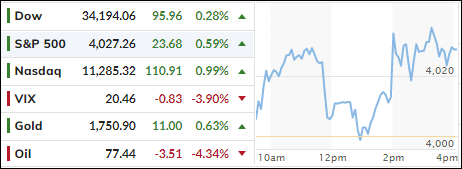
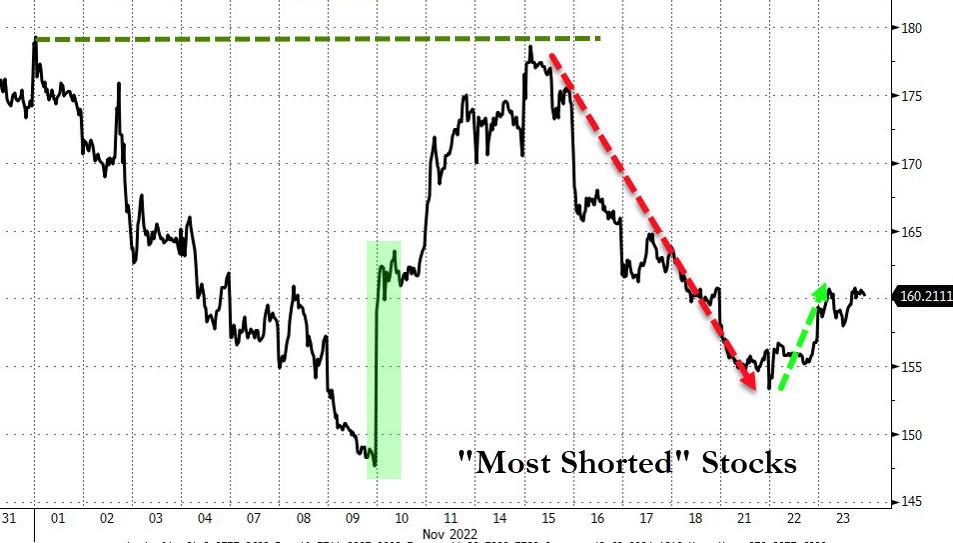
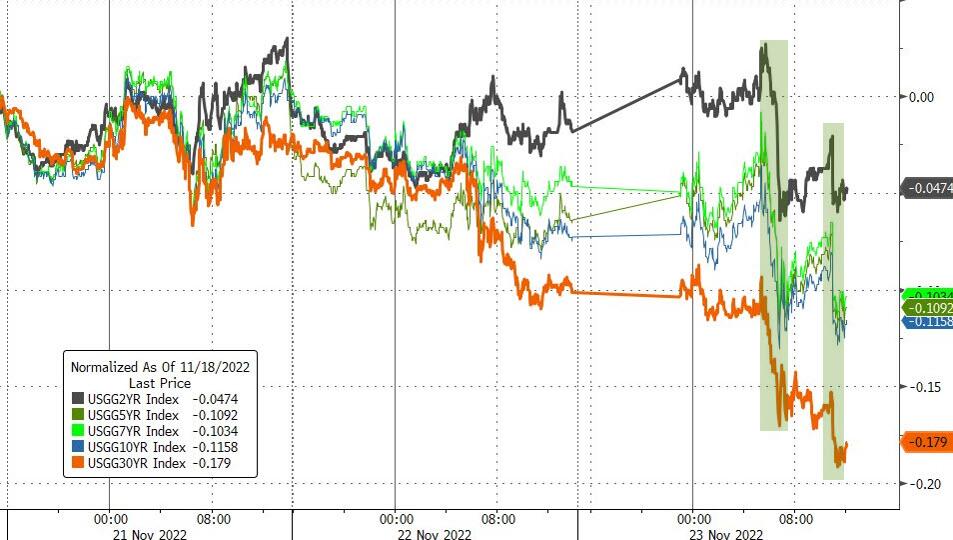
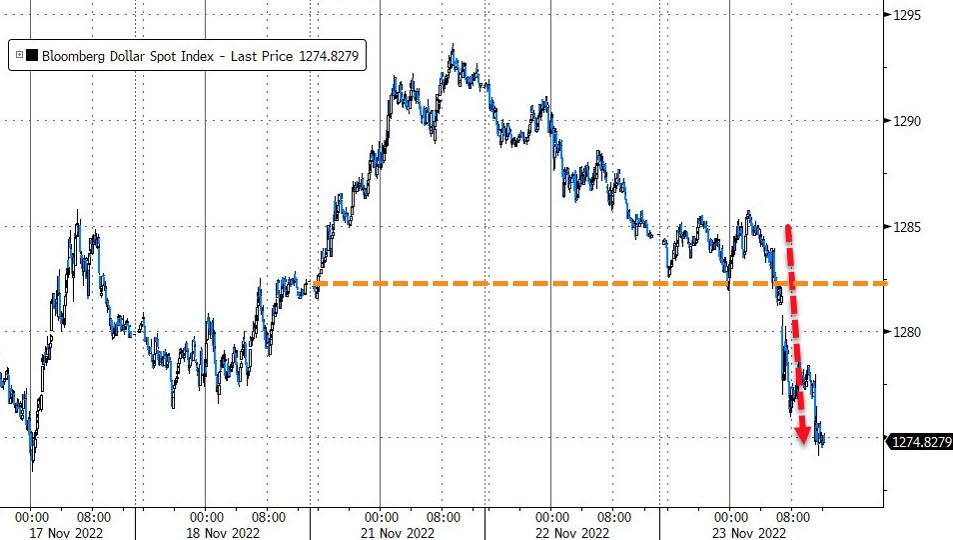
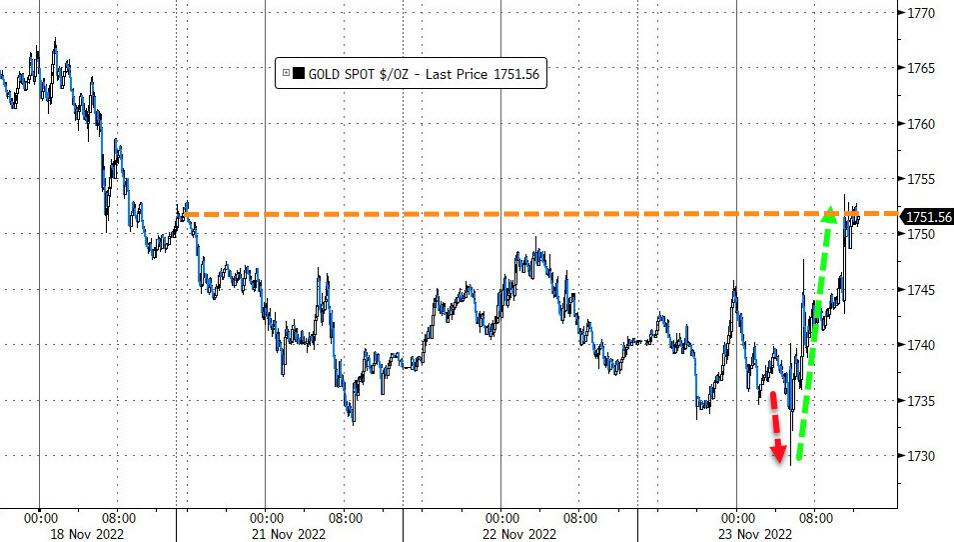
A moderate short squeeze helped bullish sentiment, as did declining bond yields with the 10-year retreating to 3.70%, down almost 13 bps. The FOMC minutes and weak econ data pushed the US Dollar lower and Gold higher, with the precious metal recapturing its $1,750 level.
Looking at the big picture, ZeroHedge added:
Since last Thanksgiving the dollar is up around 10%, gold has held its value while stocks and bonds have crashed around 25-30%.
On Friday, we will see only an abbreviated market session, so I won’t write a commentary. However, I will be back this coming Monday to witness if the returning traders, well rested from the Holiday weekend, will push the “buy” or “sell” buttons.
2. ETFs in the Spotlight
In case you missed the announcement and description of this section, you can read it here again.
It features some of the 10 broadly diversified domestic and sector ETFs from my HighVolume list as posted every Saturday. Furthermore, they are screened for the lowest MaxDD% number meaning they have been showing better resistance to temporary sell offs than all others over the past year.
The below table simply demonstrates the magnitude with which these ETFs are fluctuating above or below their respective individual trend lines (%+/-M/A). A break below, represented by a negative number, shows weakness, while a break above, represented by a positive percentage, shows strength.
For hundreds of ETF choices, be sure to reference Thursday’s StatSheet.
For this closed-out domestic “Buy” cycle (2/24/2022), here’s how some of our candidates have fared. Keep in mind that our Domestic Trend Tracking Index (TTI) signaled a “Sell” on that date, which overrode the existing “Buys” shown for SPY and IYM:

Click image to enlarge.
Again, the %+/-M/A column above shows the position of the various ETFs in relation to their respective long-term trend lines, while the trailing sell stops are being tracked in the “Off High” column. The “Action” column will signal a “Sell” once the -12% point has been taken out in the “Off High” column, which has replaced the prior -8% to -10% limits.
3. Trend Tracking Indexes (TTIs)
Our TTIs jumped again with the Domestic one now clearly having pierced its trendline. However, this move came on very low volume with most traders taking a holiday this week. If this level is maintained on Monday, I will issue a new “Buy” signal for the domestic arena.
This is how we closed 11/23/2022:
Domestic TTI: +2.79% above its M/A (prior close +2.36%)—Sell signal effective 02/24/2022.
International TTI: +1.78% above its M/A (prior close +1.02%)—Sell signal effective 03/08/2022.
Disclosure: I am obliged to inform you that I, as well as my advisory clients, own some of the ETFs listed in the above table. Furthermore, they do not represent a specific investment recommendation for you, they merely show which ETFs from the universe I track are falling within the specified guidelines.
All linked charts above are courtesy of Bloomberg via ZeroHedge.
Contact Ulli