
- Moving the markets
The efforts by a few traders last week to push the markets higher on very low volume came to an end today, when the full staff returned, pushed the sell buttons, and pulled the rug out from under last week’s rally.
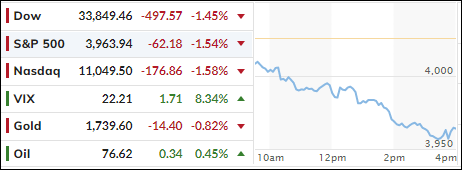
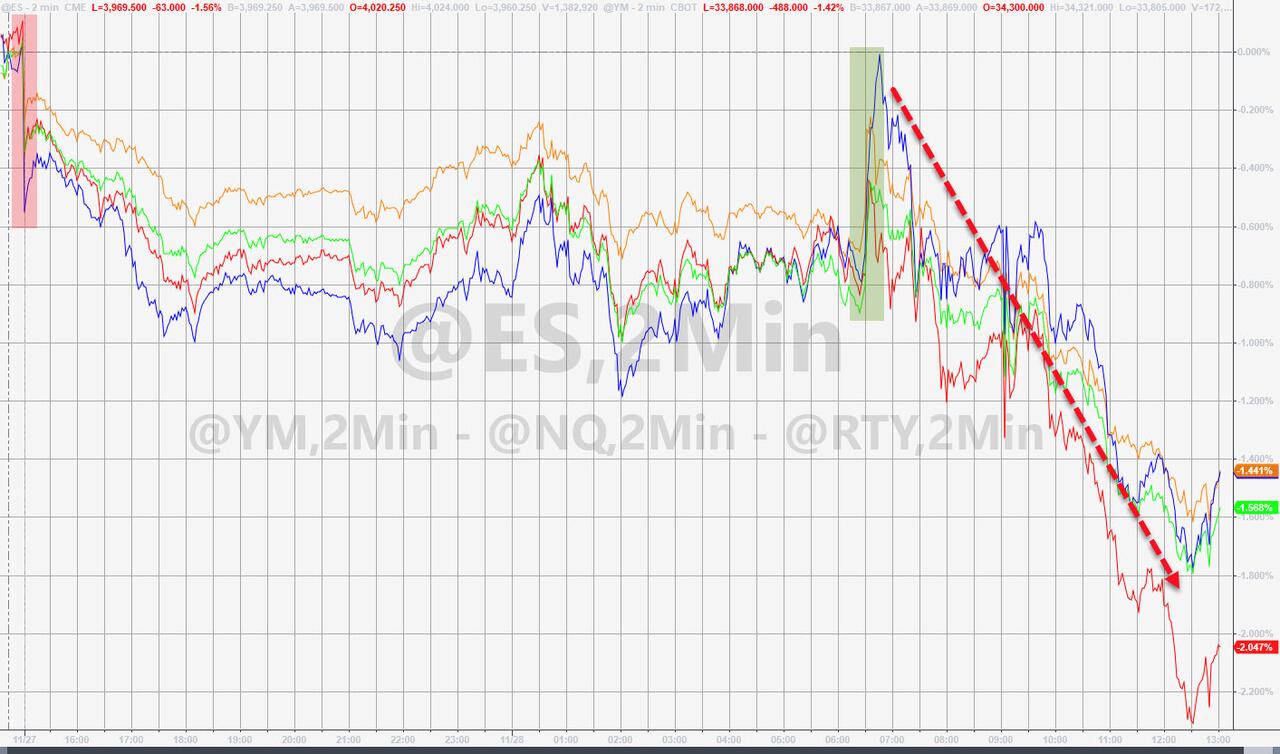
The major indexes shifted into bearish mode, right after the opening bell rang, and never stopped thereby wiping out all the Thanksgiving week gains. Our pending “Buy” signal has therefore been put on the backburner for the time being, as recent upward momentum has now been neutralized (section 3).
This long Holiday weekend introduced more disruptions to the bullish sentiment, as China’s social unrest, caused by extreme Covid restrictions, had local governments tightening their control over the population. That destroyed reopening hopes and put a downer on the world’s second biggest economy in terms of production and shipping.
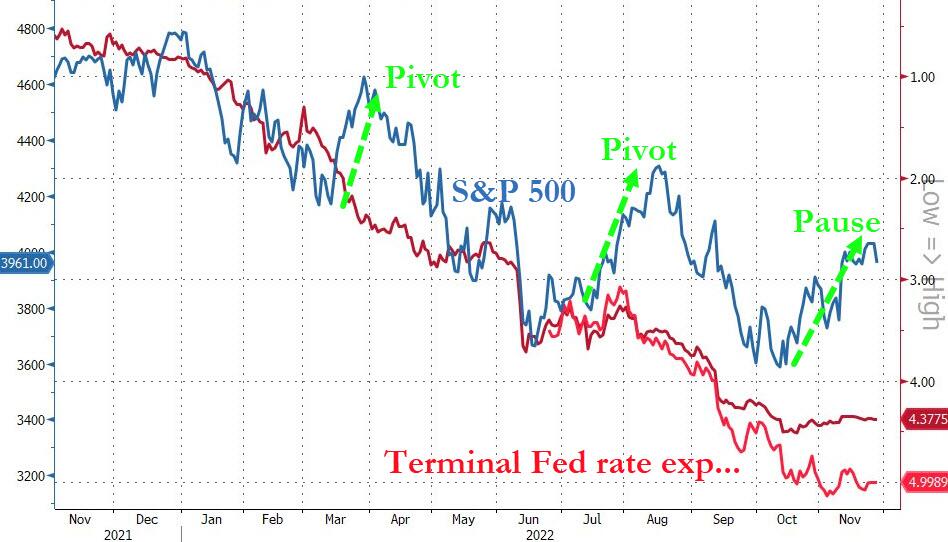
Domestically, we were treated with a barrage of hawkish messages from a variety of Fed speakers, which ZeroHedge summarized as follows:
- 0950ET *MESTER SAYS SHE DOESN’T THINK FED NEAR A PAUSE IN TIGHTENING, NEED TO SEE SEVERAL MORE GOOD INFLATION READINGS
- 1200ET *WILLIAMS SAYS FED STILL HAS MORE WORK TO DO ON INFLATION, FURTHER TIGHTENING SHOULD HELP REDUCE INFLATION
- 1200ET *BULLARD: RISK THAT FED WILL HAVE TO GO HIGHER ON RATES IN 2023, MARKETS UNDERPRICING RISK FOMC MAY BE MORE AGGRESSIVE, FED HAS `A WAYS TO GO TO GET TO’ RESTRICTIVE RATES, FIRST 250 BPS OF TIGHTENING WAS JUST GETTING TO NEUTRAL, TIME TO LET QT PROGRAM RUN FOR NOW; SO FAR, SO GOOD
This was the final nail in the bearish coffin, and down we went. Even the most shorted stocks were not squeezed today, so they followed their natural tendencies, namely lower.
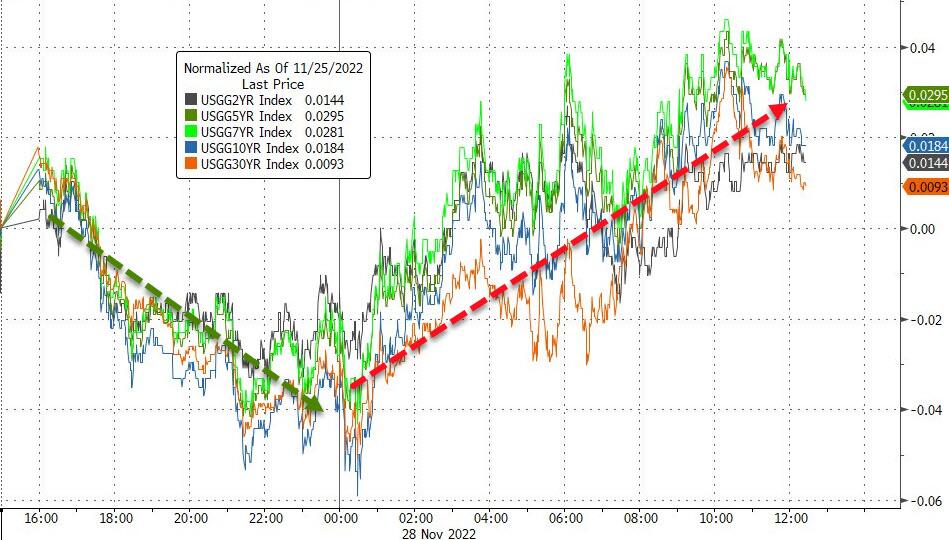
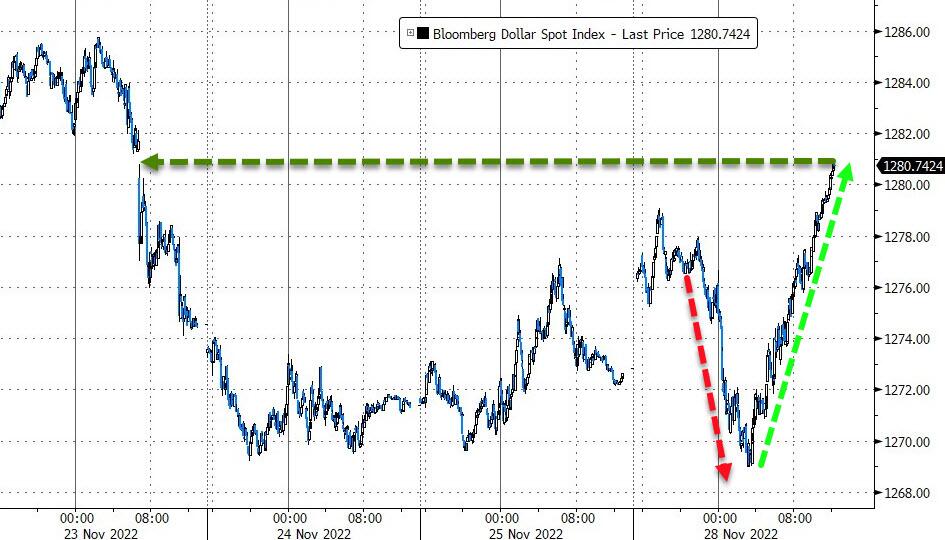
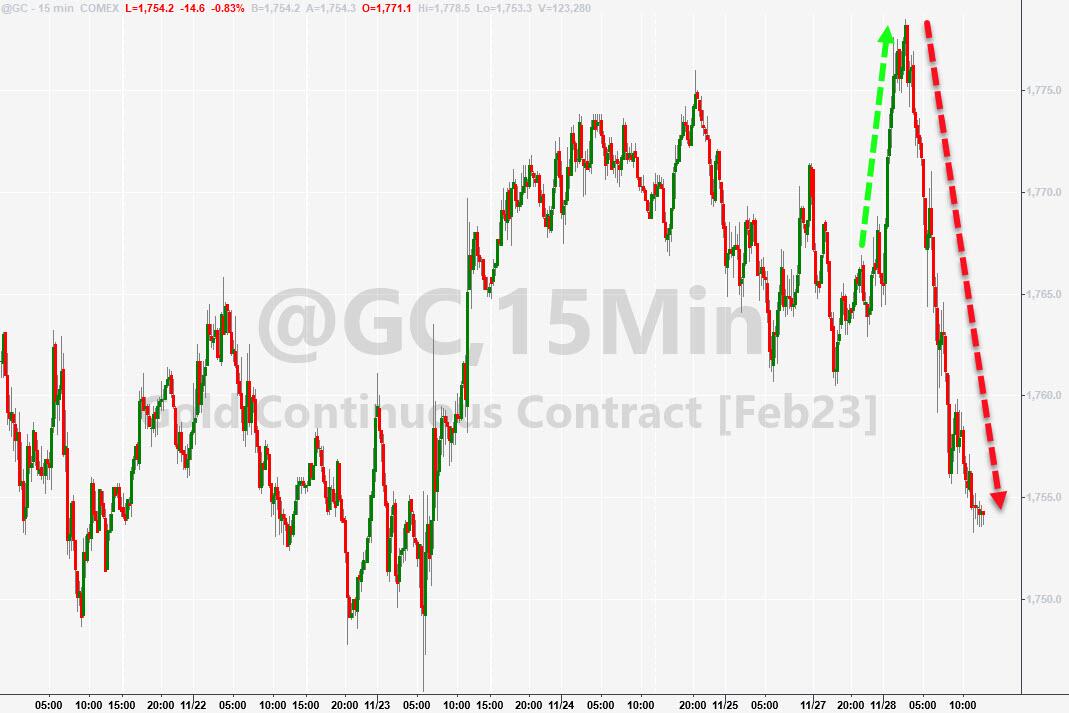
Bond yields retreated with the 10-year ending just about unchanged at 3.68%, as the US Dollar rode a rollercoaster in the process reversing recent losses. Gold followed suit but ended the day lower.
The S&P 500 has reached another critical point, namely its 200-day M/A, which is now in striking distance. Will we see a “threepeat,” or will the index finally break through this stubborn resistance level and support the bullish meme?
Only time will tell.
2. ETFs in the Spotlight
In case you missed the announcement and description of this section, you can read it here again.
It features some of the 10 broadly diversified domestic and sector ETFs from my HighVolume list as posted every Saturday. Furthermore, they are screened for the lowest MaxDD% number meaning they have been showing better resistance to temporary sell offs than all others over the past year.
The below table simply demonstrates the magnitude with which these ETFs are fluctuating above or below their respective individual trend lines (%+/-M/A). A break below, represented by a negative number, shows weakness, while a break above, represented by a positive percentage, shows strength.
For hundreds of ETF choices, be sure to reference Thursday’s StatSheet.
For this closed-out domestic “Buy” cycle (2/24/2022), here’s how some of our candidates have fared. Keep in mind that our Domestic Trend Tracking Index (TTI) signaled a “Sell” on that date, which overrode the existing “Buys” shown for SPY and IYM:
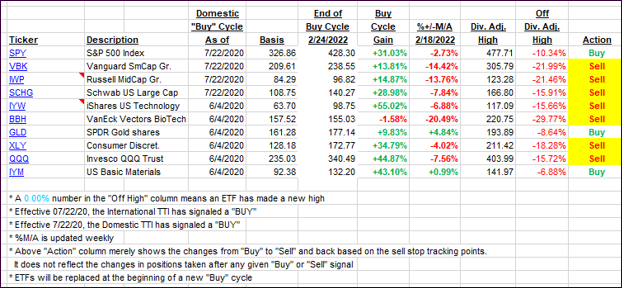
Click image to enlarge.
Again, the %+/-M/A column above shows the position of the various ETFs in relation to their respective long-term trend lines, while the trailing sell stops are being tracked in the “Off High” column. The “Action” column will signal a “Sell” once the -12% point has been taken out in the “Off High” column, which has replaced the prior -8% to -10% limits.
3. Trend Tracking Indexes (TTIs)
Our TTIs reversed and took a sharp dive, thereby causing us to remain on the sidelines and invalidating last week’s low volume bounce. While both indexes remain on the bullish side of their respective trend lines, the margin is very small, so I need to see more upside momentum before pulling the trigger on a new “Buy” signal.
This is how we closed 11/28/2022:
Domestic TTI: +1.40% above its M/A (prior close +3.24%)—Sell signal effective 02/24/2022.
International TTI: +1.03% above its M/A (prior close +2.45%)—Sell signal effective 03/08/2022.
Disclosure: I am obliged to inform you that I, as well as my advisory clients, own some of the ETFs listed in the above table. Furthermore, they do not represent a specific investment recommendation for you, they merely show which ETFs from the universe I track are falling within the specified guidelines.
All linked charts above are courtesy of Bloomberg via ZeroHedge.
Contact Ulli