
- Moving the markets
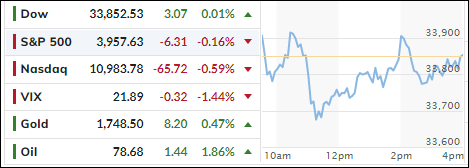
While the major indexes wandered aimlessly throughout the session, they at least managed to dig themselves out of an early hole, crawled back and reduced their losses. In the end, not much was gained or lost.
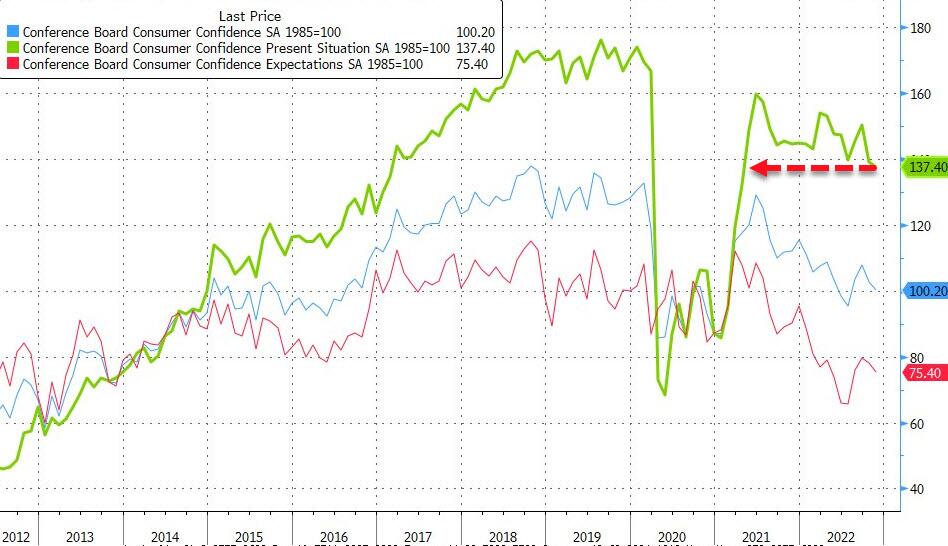
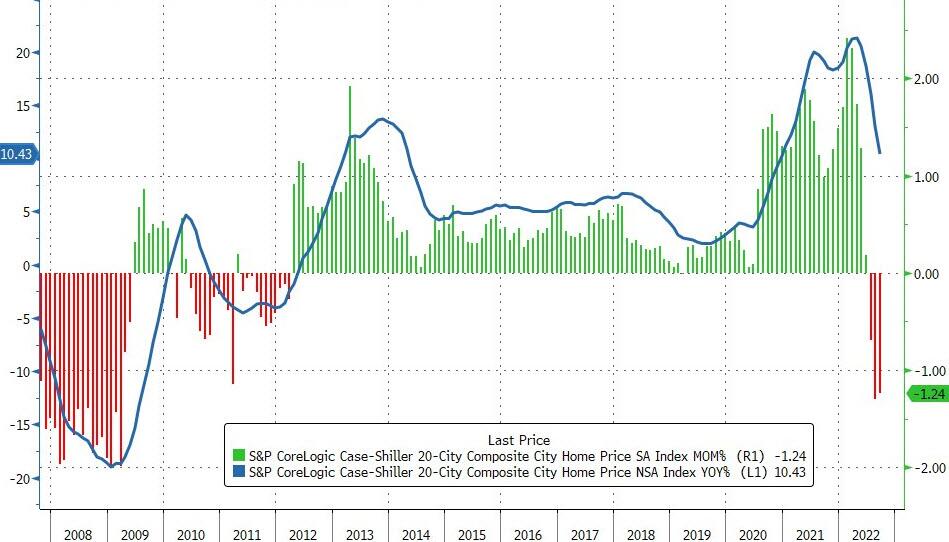
Economic data points did nothing to encourage bullish sentiment with Consumer Confidence dropping in October, while Inflation Expectations jumped. US Home prices declined for the 3rd straight month in September, as ZeroHedge reported, clearly a consequence of soaring mortgage rates.
All eyes are now on Fed head Powell’s speech tomorrow when observers will be hunting for clues whether the central bank might pause or even stop interest rate hikes. It appears that this kind of hopeful thinking, despite Powell & Co having clearly and repeatedly announced that they are nowhere near the Fed’s expected termination rate—now at 5-7%.
CNBC called the next 10 to 14 days a “data-rich period”, which may help clarify if inflation and economic growth can be balanced and, I suppose, co-exist. This Friday’s labor report and next week’s PPI number will add important context to see if this bear market bounce can be extended or not.
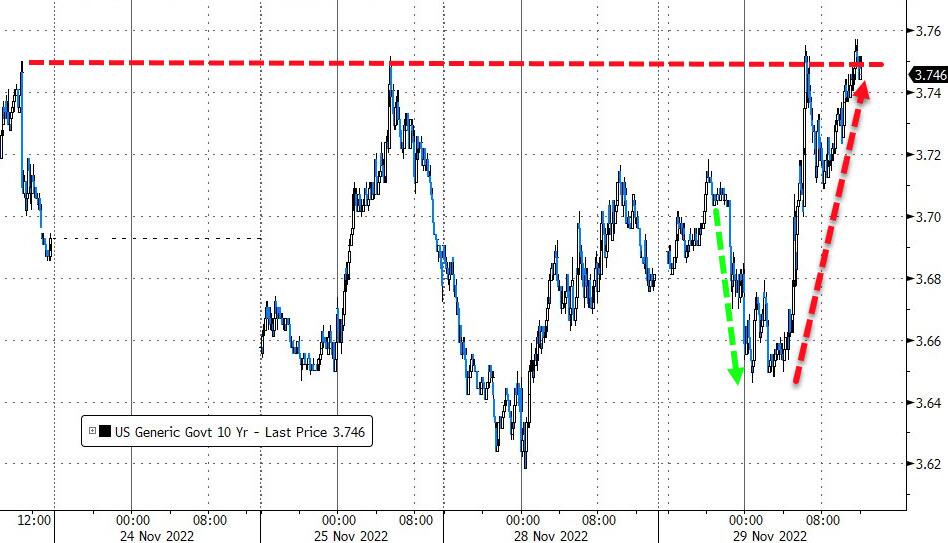
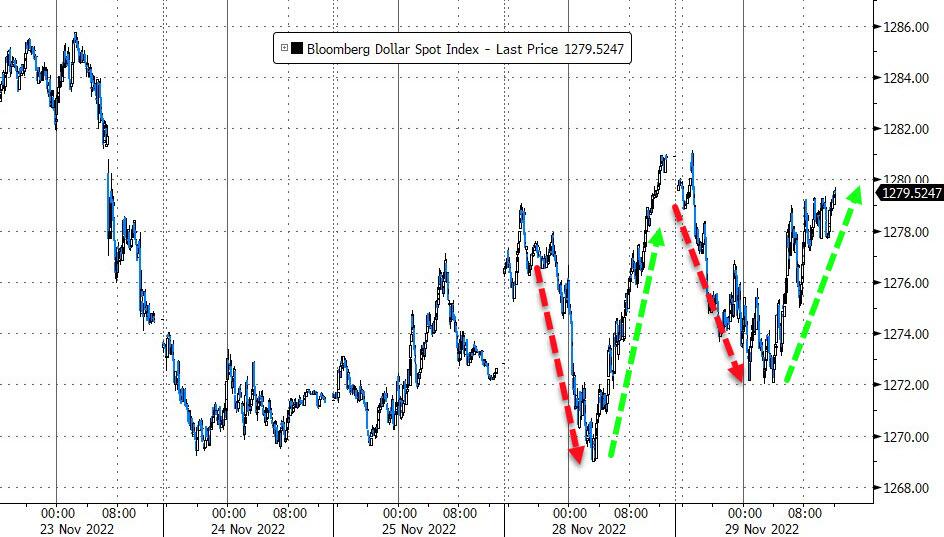
Bond yields rose a tad, with the widely followed 10-year bouncing off of yesterday’s lows. The US Dollar rode the roller-coaster again and slipped from yesterday’s close, thereby helping Gold to score some gains for the session.
Looking at the big picture, it appears that Central Banks all over the world are continuing to be in more of a tightening mood to battle the inflation monster, which has adversely affected consumer prices around the globe.
2. ETFs in the Spotlight
In case you missed the announcement and description of this section, you can read it here again.
It features some of the 10 broadly diversified domestic and sector ETFs from my HighVolume list as posted every Saturday. Furthermore, they are screened for the lowest MaxDD% number meaning they have been showing better resistance to temporary sell offs than all others over the past year.
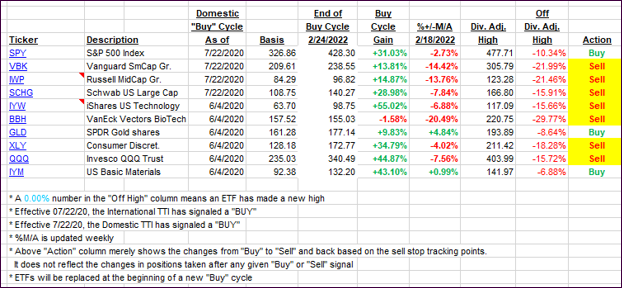
The below table simply demonstrates the magnitude with which these ETFs are fluctuating above or below their respective individual trend lines (%+/-M/A). A break below, represented by a negative number, shows weakness, while a break above, represented by a positive percentage, shows strength.
For hundreds of ETF choices, be sure to reference Thursday’s StatSheet.
For this closed-out domestic “Buy” cycle (2/24/2022), here’s how some of our candidates have fared. Keep in mind that our Domestic Trend Tracking Index (TTI) signaled a “Sell” on that date, which overrode the existing “Buys” shown for SPY and IYM:
Click image to enlarge.
Again, the %+/-M/A column above shows the position of the various ETFs in relation to their respective long-term trend lines, while the trailing sell stops are being tracked in the “Off High” column. The “Action” column will signal a “Sell” once the -12% point has been taken out in the “Off High” column, which has replaced the prior -8% to -10% limits.
3. Trend Tracking Indexes (TTIs)
Our TTIs improved a tad, but the margin to their respective trend lines is still too small to call it the end to the current bearish cycle.
This is how we closed 11/29/2022:
Domestic TTI: +1.72% above its M/A (prior close +1.40%)—Sell signal effective 02/24/2022.
International TTI: +1.47% above its M/A (prior close +1.03%)—Sell signal effective 03/08/2022.
Disclosure: I am obliged to inform you that I, as well as my advisory clients, own some of the ETFs listed in the above table. Furthermore, they do not represent a specific investment recommendation for you, they merely show which ETFs from the universe I track are falling within the specified guidelines.
All linked charts above are courtesy of Bloomberg via ZeroHedge.
Contact Ulli