
ETF Tracker StatSheet
You can view the latest version here.
TREADING WATER
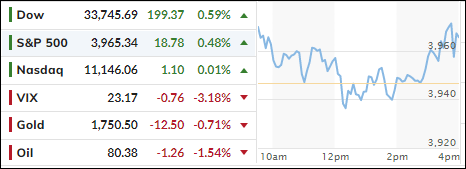
[Chart courtesy of MarketWatch.com]
- Moving the markets
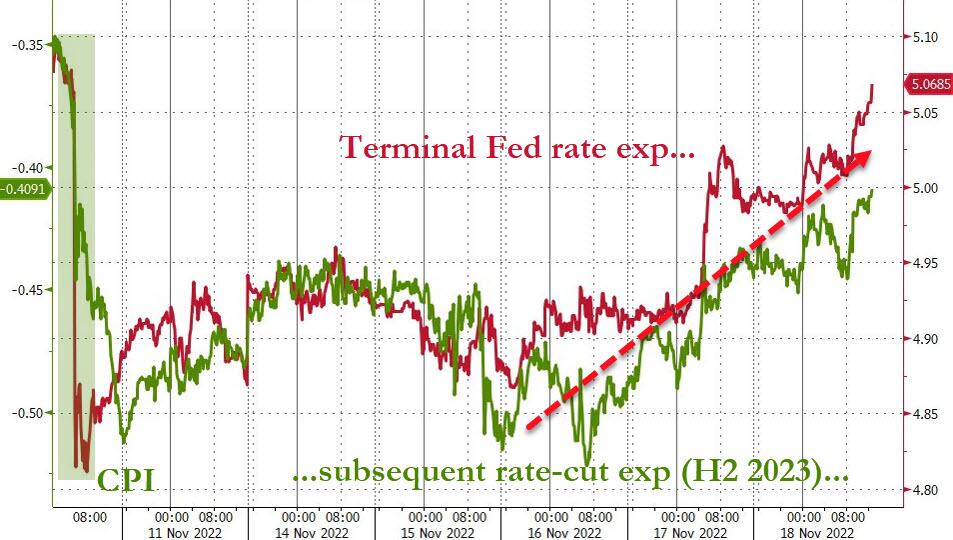
Despite the tough language used by St. Louis’ Fed President Bullard yesterday, that a benchmark interest rate in the range of 5%-7% would be needed to bring down inflation, the Wall Street crowd refuses to pay attention and still lives the dream that the Fed will soon have to pivot (lower rates).
For weeks now, a variety of other Fed mouth pieces having been singing similar tunes from the same hymn book to no avail, as traders and algos alike continue to focus on the hope that peak inflation and peak rates are now clearly visible in the rearview mirror, and that good times for the markets are ahead of us.
Added ZeroHedge:
- 16 different speeches from Fed speakers this week – all with the same message: higher rates for longer; no pause or pivot imminent…
And in more detail:
- Bostic: more rate-hikes needed, “must keep rates at peak” until inflation on track for 2%
- Bullard: rates could rise to 7%, “burned two years in a row on inflation optimism”
- Waller: Fed still has “long way to go” on rate-hikes
- Daly: “pause is off the table“
- Kashkari: “not seeing evidence of underlying demand cooling“, “not there yet” to pause rate-hikes
- Collins: 75bps still on the table, “no clear evidence that inflation coming down”
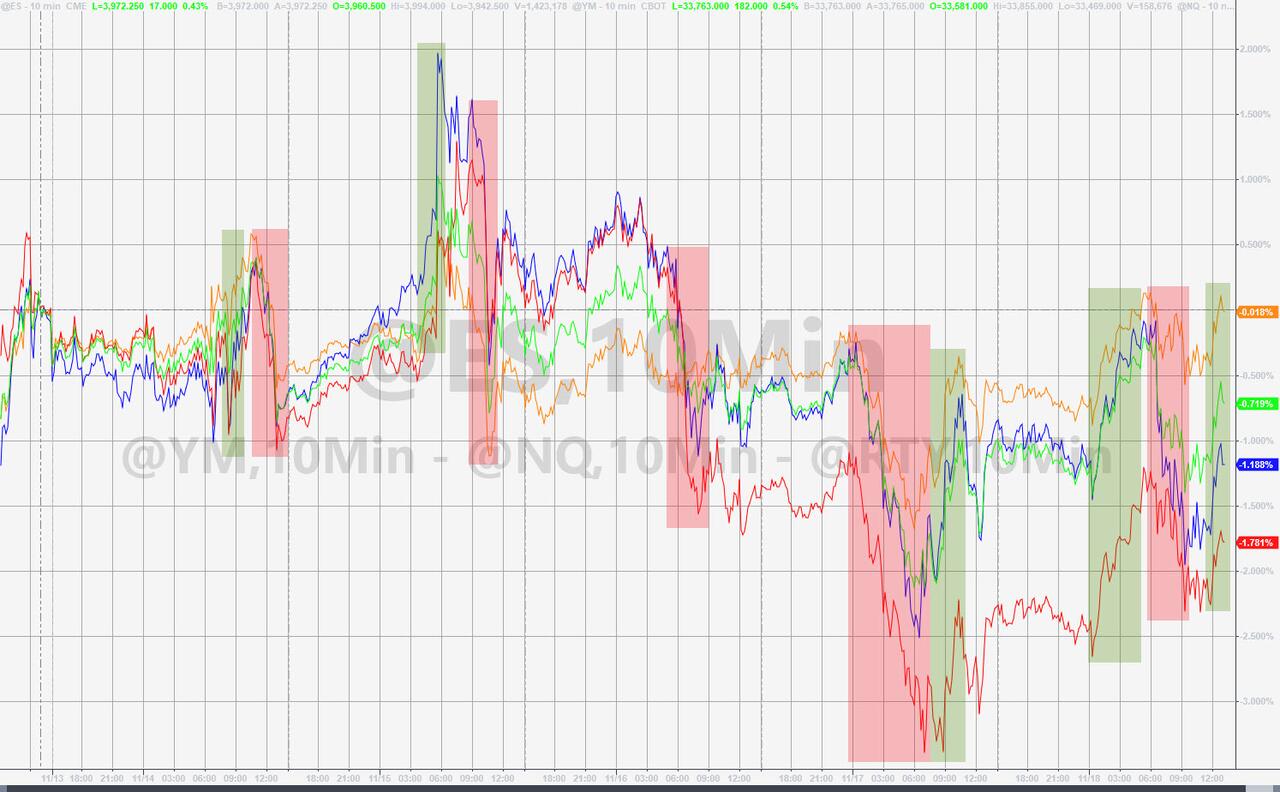
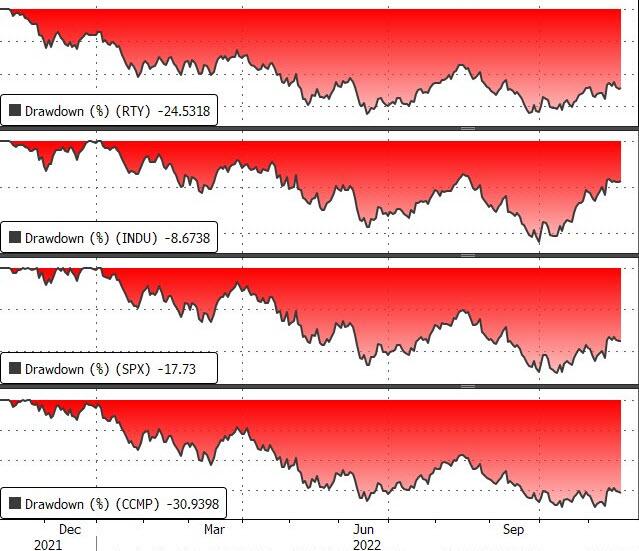
Suffice to say that, after last week’s Ramp-A-Thon, things slowed down during the past 5 trading days, during which the major indexes went nowhere with the S&P 500 surrendering a modest -0.7%. For the month, however, all are showing positive numbers from the CPI induced rebound.
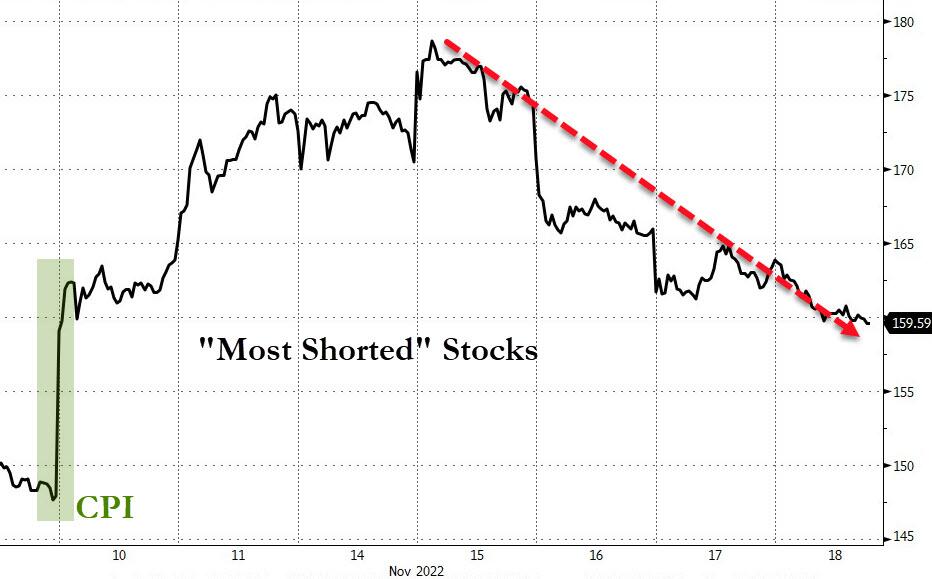
The lack of upside follow through can also be attributed to the “dying short squeeze,” as most shorted stocks did what they are supposed, namely go down. You could pretty much say that for the entire market which, as ZeroHedge pointed out, headed south with utter abundance.
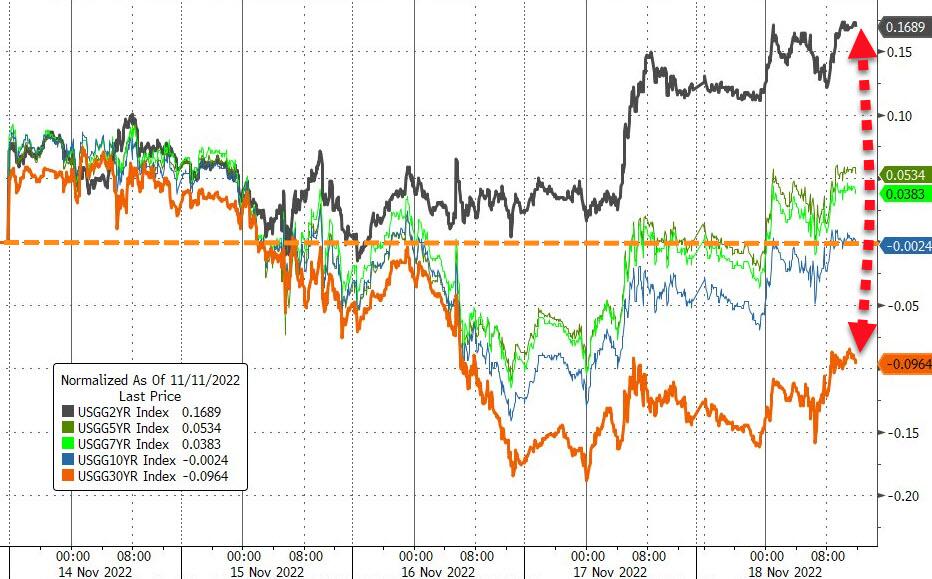
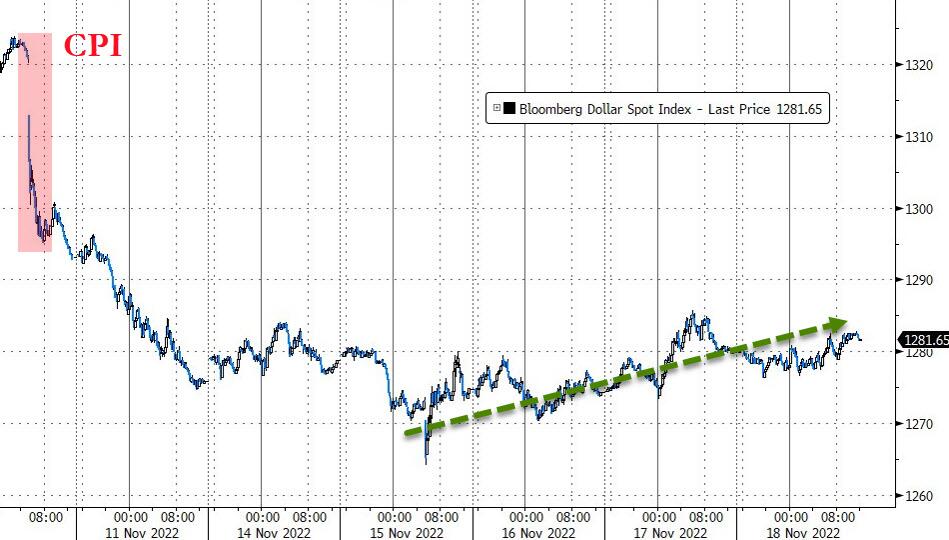
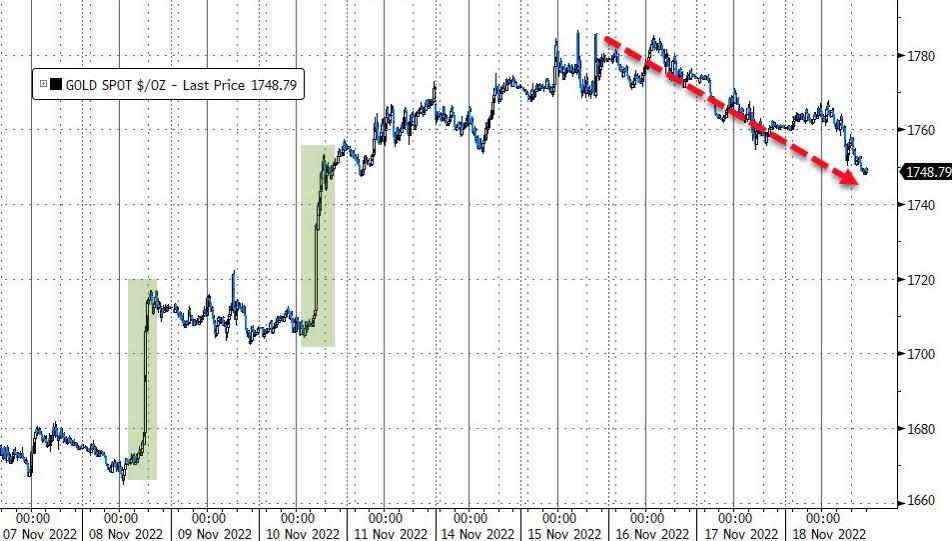
Bond yields were mixed with the 2-year pumping and the 30-year dumping. The US dollar edged higher, while gold slipped but held on to its $1,750 level.
From a directional point of view, our Trend Tracking Indexes (TTIs) performed the trend line dance with not much won or lost, and no clear direction is discernable at this time (section 3).
2. ETFs in the Spotlight
In case you missed the announcement and description of this section, you can read it here again.
It features some of the 10 broadly diversified domestic and sector ETFs from my HighVolume list as posted every Saturday. Furthermore, they are screened for the lowest MaxDD% number meaning they have been showing better resistance to temporary sell offs than all others over the past year.
The below table simply demonstrates the magnitude with which these ETFs are fluctuating above or below their respective individual trend lines (%+/-M/A). A break below, represented by a negative number, shows weakness, while a break above, represented by a positive percentage, shows strength.
For hundreds of ETF choices, be sure to reference Thursday’s StatSheet.
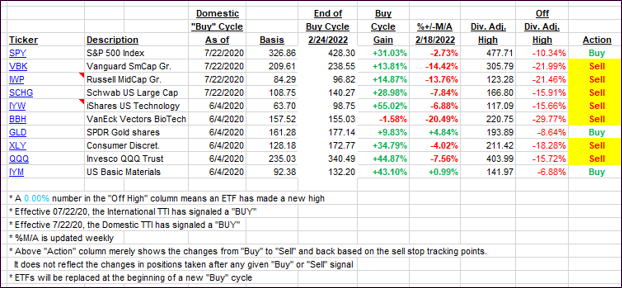
For this closed-out domestic “Buy” cycle (2/24/2022), here’s how some of our candidates have fared. Keep in mind that our Domestic Trend Tracking Index (TTI) signaled a “Sell” on that date, which overrode the existing “Buys” shown for SPY and IYM:
Click image to enlarge.
Again, the %+/-M/A column above shows the position of the various ETFs in relation to their respective long-term trend lines, while the trailing sell stops are being tracked in the “Off High” column. The “Action” column will signal a “Sell” once the -12% point has been taken out in the “Off High” column, which has replaced the prior -8% to -10% limits.
3. Trend Tracking Indexes (TTIs)
Our TTIs recovered a bit from yesterday’s sell-off but are still stuck in a tight trading range around their respective trend lines.
This is how we closed 11/18/2022:
Domestic TTI: +1.06% above its M/A (prior close +0.20%)—Sell signal effective 02/24/2022.
International TTI: +0.33% above its M/A (prior close -0.34%)—Sell signal effective 03/08/2022.
Disclosure: I am obliged to inform you that I, as well as my advisory clients, own some of the ETFs listed in the above table. Furthermore, they do not represent a specific investment recommendation for you, they merely show which ETFs from the universe I track are falling within the specified guidelines.
All linked charts above are courtesy of Bloomberg via ZeroHedge.
———————————————————-
WOULD YOU LIKE TO HAVE YOUR INVESTMENTS PROFESSIONALLY MANAGED?
Do you have the time to follow our investment plans yourself? If you are a busy professional who would like to have his portfolio managed using our methodology, please contact me directly to get more details.
Contact Ulli