
ETF Tracker StatSheet
You can view the latest version here.
PUMPED, THEN DUMPED
- Moving the markets
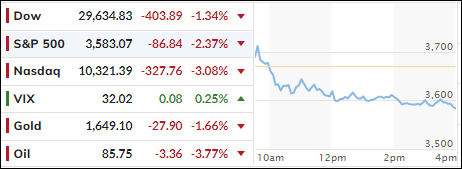
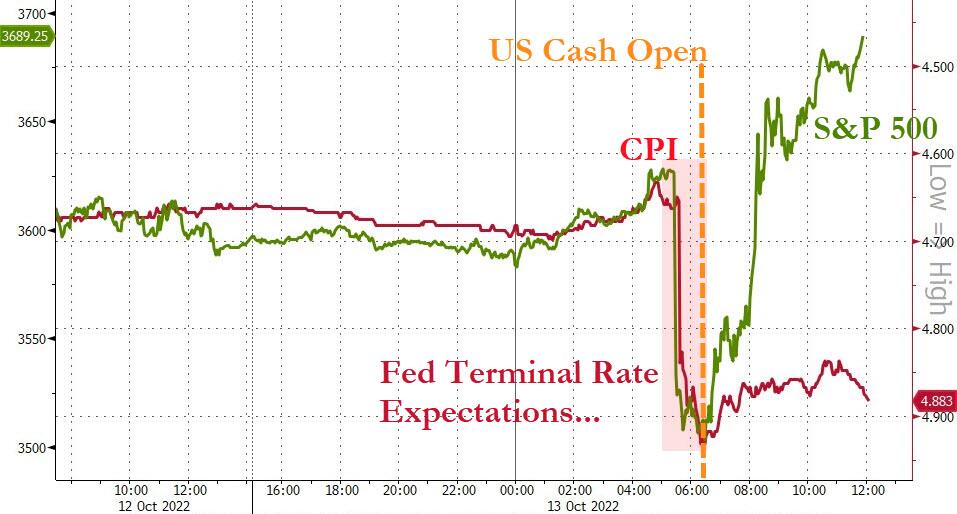
Yesterday’s market reversal, that saw Dow swing from a minus 500 points to a plus 800 points, marked the fifth largest in history. The worse than expected CPI report (+8.2% YoY), with the core number surging to 40-year highs, slammed the markets, but a sudden turnaround created a massive rally with the major indexes ending the session solidly in the green.
From my vantage point there was more involved than meets the eye, and I suspect that the Plunge Protection Team (PPP) stepped in to avoid a total market meltdown and pushed the indexes higher, after which the enormous number of shorts were forced to liquidate thereby creating a massive short squeeze and turning bad news into a good outcome for the markets.
As is the case with engineered market direction, the outcome very often results in nothing more than a dead-cat-bounce. And that is exactly what was confirmed today, as the bears took charge and installed some realism by knocking the indexes off yesterday’s level. The S&P 500’s gain of +2.6% was pretty much wiped out by today’s -2.37% loss, which put the index right back to where it started the month.
Contributing to today’s weakness was a consumer survey by the University of Michigan showing that inflation expectations were increasing, a sentiment that is watched closely by the Fed and may influence their future actions.
Not helping the bullish theme were reports of a brewing banking crisis. Last week, it was the BoE, which had to step in to save its bonds from crashing and by extension, their pension funds from collapsing.
Then, a few days ago, we learned that the Fed quietly wired some $3 billion to Switzerland, which was followed today by another $6.3 billion. Judging by recent reports, there is a dollar funding shortage very likely connected with the latest news about the Credit Suisse bank having “issues.”
ZeroHedge summed it up like this:
And speaking of the coming crisis, recall what we said at the start of September: the coming Fed pivot will have nothing to do with whether the Fed hits or doesn’t hit its inflation target, and everything to do with the devastation unleashed by the soaring dollar (a record margin call to the tune of some $20 trillion) on the rest of the world.
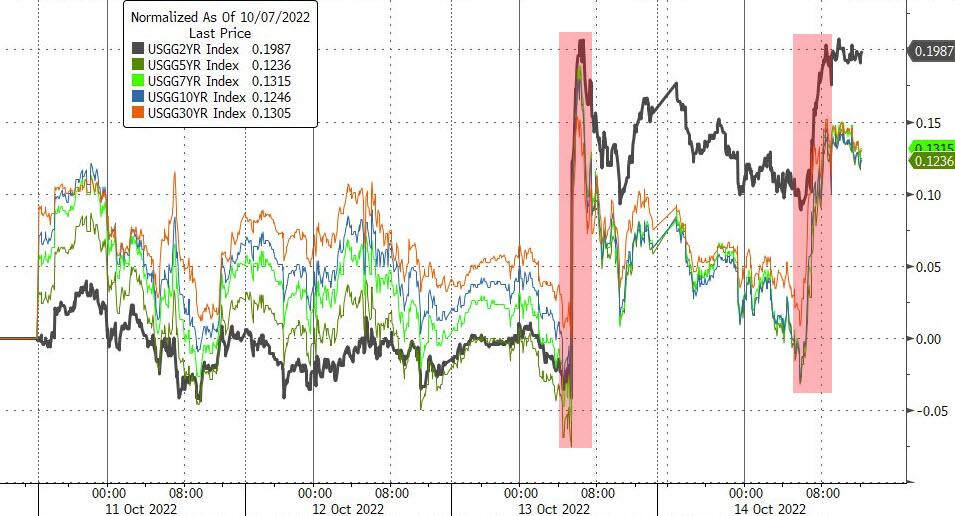
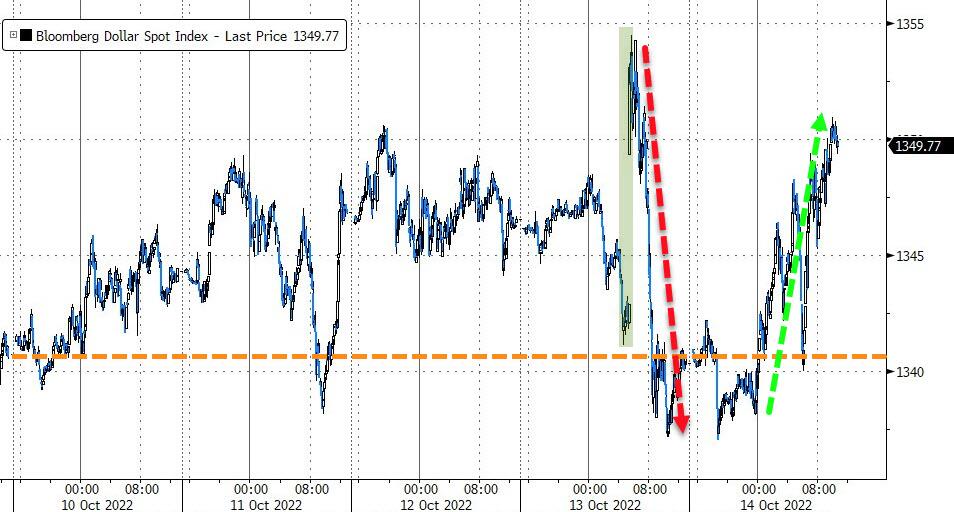
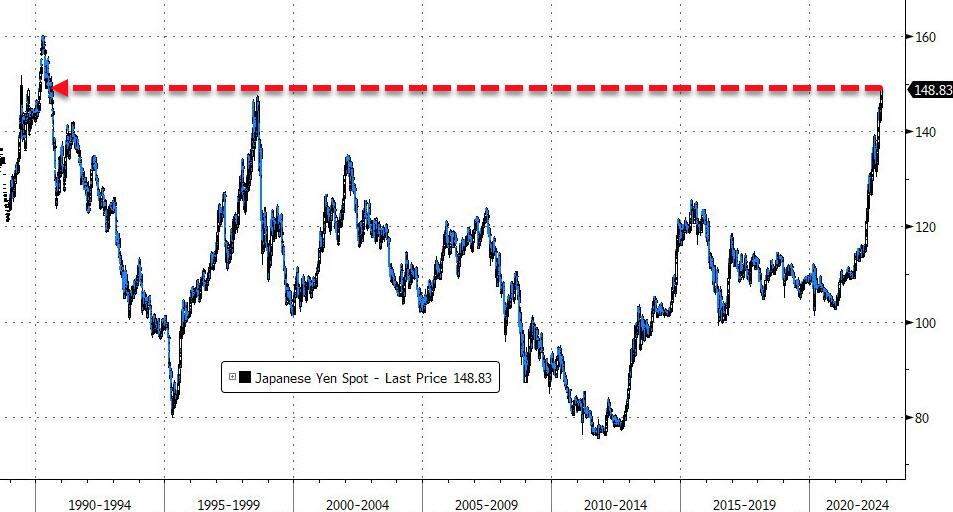
Here is the US, bond yields rallied with the 10-year finally conquering its 4% glass ceiling and closing above it at 4.02%. The US Dollar swung wildly but rallied for a second straight week, which crashed the Japanese Yen to its weakest since 1990! Ouch.
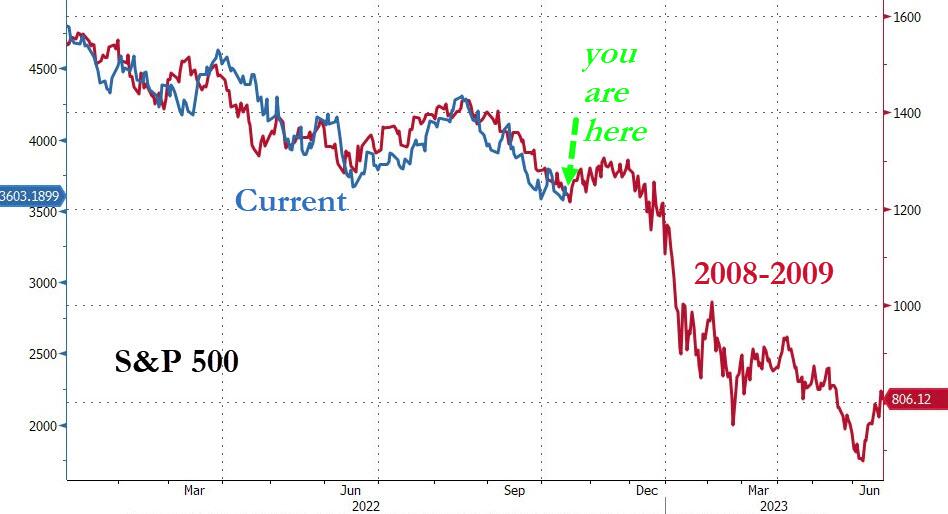
After another wild week, which should have finally made it clear that the best spot to watch this carnage from is sitting in cash on the sidelines, the analog to 2008-2009 remains disconcertingly on track.
2. ETFs in the Spotlight
In case you missed the announcement and description of this section, you can read it here again.
It features some of the 10 broadly diversified domestic and sector ETFs from my HighVolume list as posted every Saturday. Furthermore, they are screened for the lowest MaxDD% number meaning they have been showing better resistance to temporary sell offs than all others over the past year.
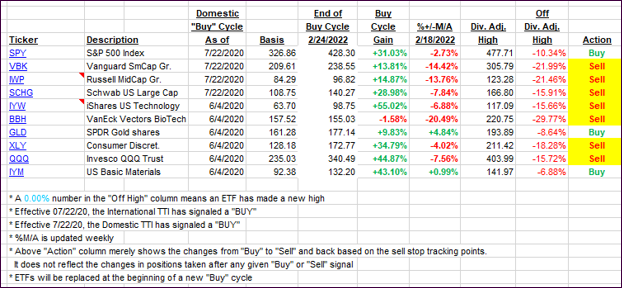
The below table simply demonstrates the magnitude with which these ETFs are fluctuating above or below their respective individual trend lines (%+/-M/A). A break below, represented by a negative number, shows weakness, while a break above, represented by a positive percentage, shows strength.
For hundreds of ETF choices, be sure to reference Thursday’s StatSheet.
For this closed-out domestic “Buy” cycle (2/24/2022), here’s how some of our candidates have fared. Keep in mind that our Domestic Trend Tracking Index (TTI) signaled a “Sell” on that date, which overrode the existing “Buys” shown for SPY and IYM:
Click image to enlarge.
Again, the %+/-M/A column above shows the position of the various ETFs in relation to their respective long-term trend lines, while the trailing sell stops are being tracked in the “Off High” column. The “Action” column will signal a “Sell” once the -12% point has been taken out in the “Off High” column, which has replaced the prior -8% to -10% limits.
3. Trend Tracking Indexes (TTIs)
Our TTIs lost yesterday’s upward momentum and sank deeper into bear market territory.
This is how we closed 10/14/2022:
Domestic TTI: -11.29% below its M/A (prior close -9.78%)—Sell signal effective 02/24/2022.
International TTI: -14.32% below its M/A (prior close -14.24%)—Sell signal effective 03/08/2022.
Disclosure: I am obliged to inform you that I, as well as my advisory clients, own some of the ETFs listed in the above table. Furthermore, they do not represent a specific investment recommendation for you, they merely show which ETFs from the universe I track are falling within the specified guidelines.
All linked charts above are courtesy of Bloomberg via ZeroHedge.
———————————————————-
WOULD YOU LIKE TO HAVE YOUR INVESTMENTS PROFESSIONALLY MANAGED?
Do you have the time to follow our investment plans yourself? If you are a busy professional who would like to have his portfolio managed using our methodology, please contact me directly to get more details.
Contact Ulli