
ETF Tracker StatSheet
You can view the latest version here.
SEESAWING FOR THE DAY AND DUMPING FOR THE WEEK
- Moving the markets
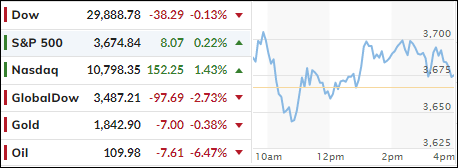
Stocks were fortunate that today’s $3.9 trillion quadruple options expiration’s event did not do more damage to an already beaten down equity market. While it was a seesaw day, the major indexes ended the session hugging their respective trend lines with the Nasdaq finally showing a moderately green close.
Yesterday’s spanking, during which the Dow dropped some 750 points, pulled the index below its psychologically important 30k level, but bearish momentum was too strong today for it to recover that milestone marker.
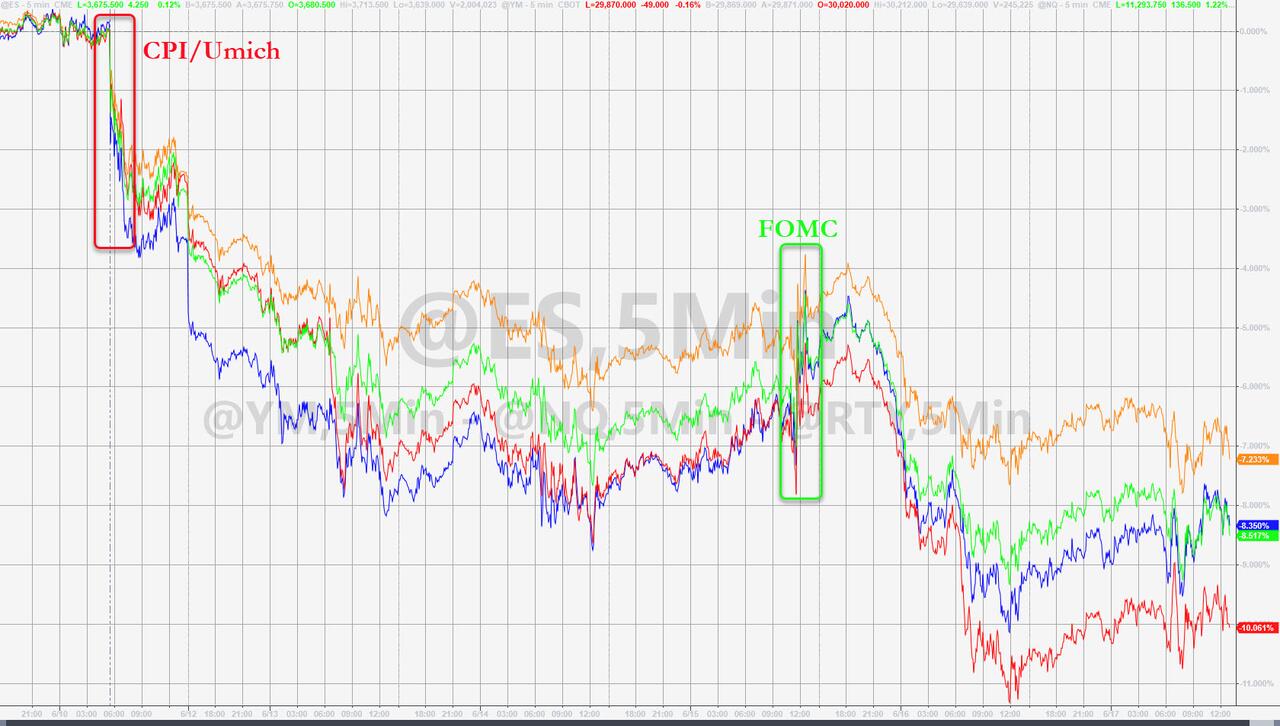
Despite the S&P’s feeble attempt to close above its unchanged line, for the week it posted its worst loss (-5.8%) since 2020. It was a brutal five days for all the major indexes, as we are not only facing higher interest rates but also an economic slowdown.
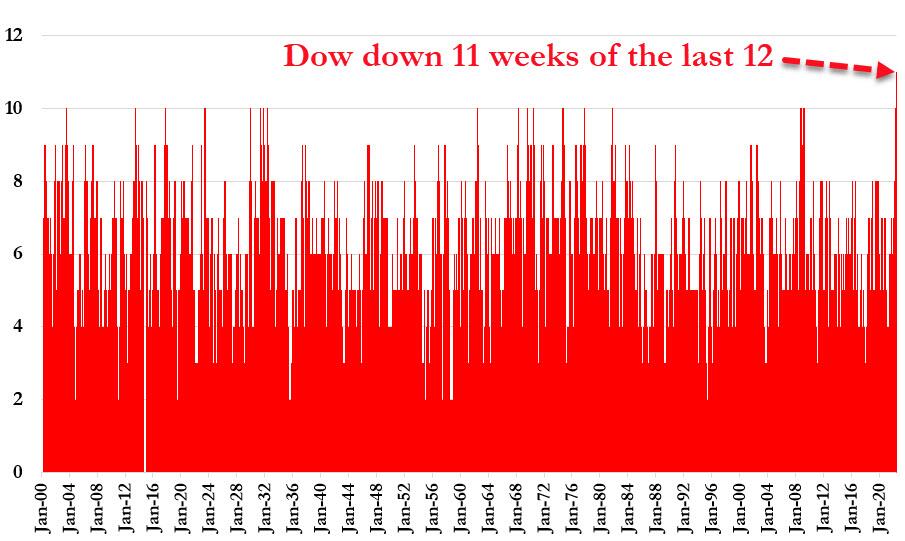
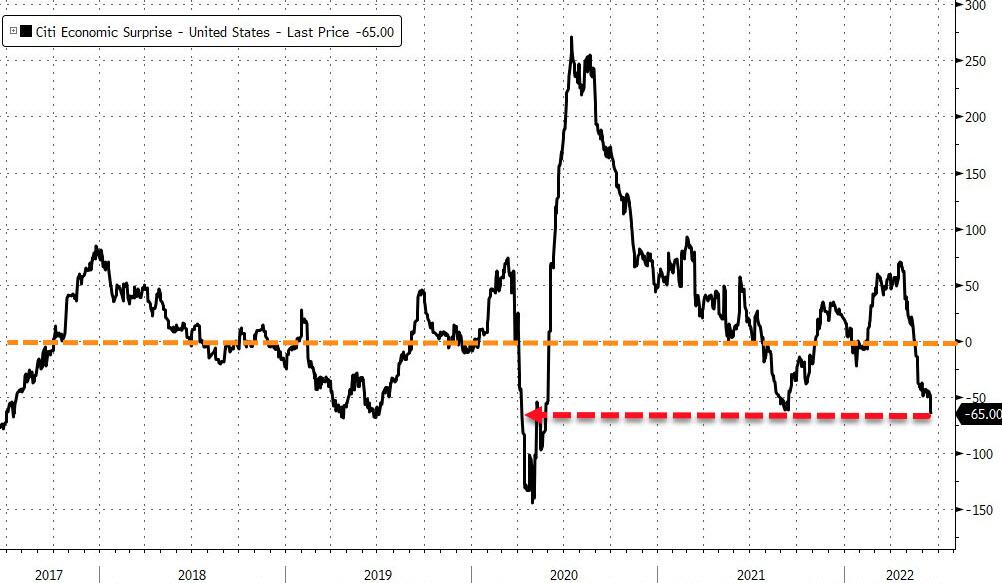
The Dow has had now 11 down weeks out of the last 12, which has never happened before, as Macro Data is collapsing at an unprecedented rate. Quipped ZeroHedge:
Remember, there are 12 more rate hike priced in from here…good luck America
Then this from JPM head of trading desk, Elan Luger:
“I think we are past inflation at this point. The only thing confirmed yesterday is that the Fed will to do whatever it takes to get inflation back to target. If that means slowing the economy to a halt and crashing the stock market, so be it.”
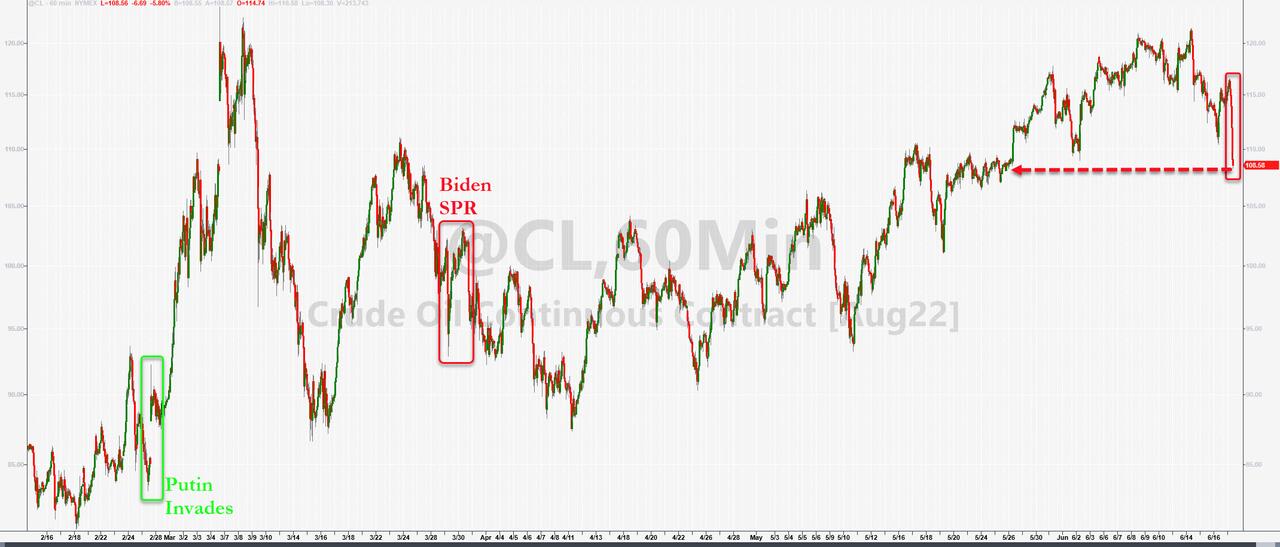
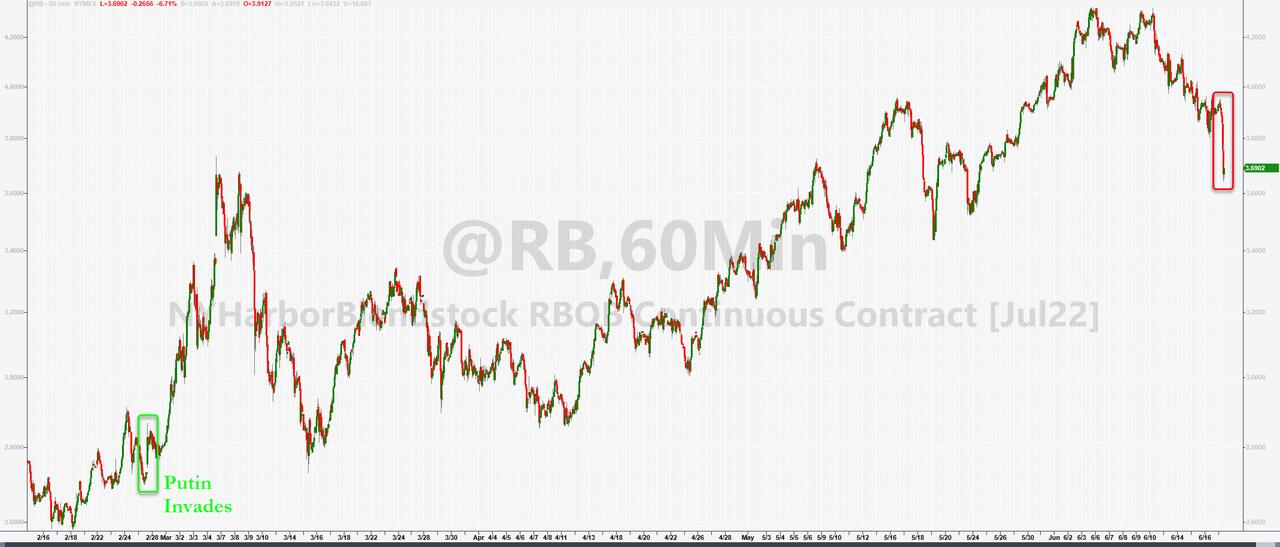
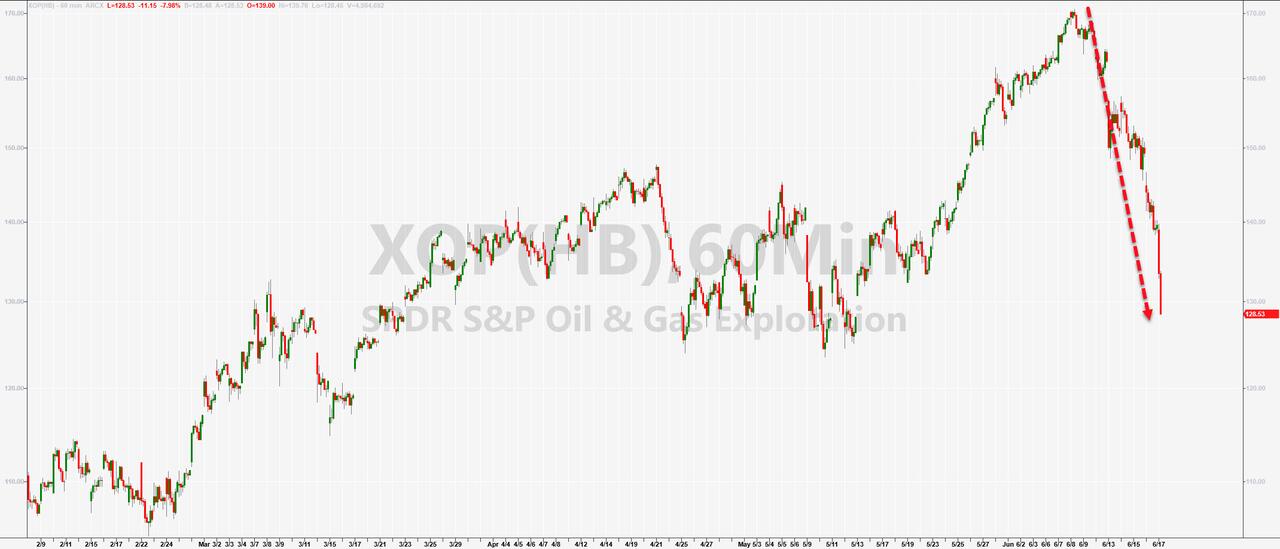
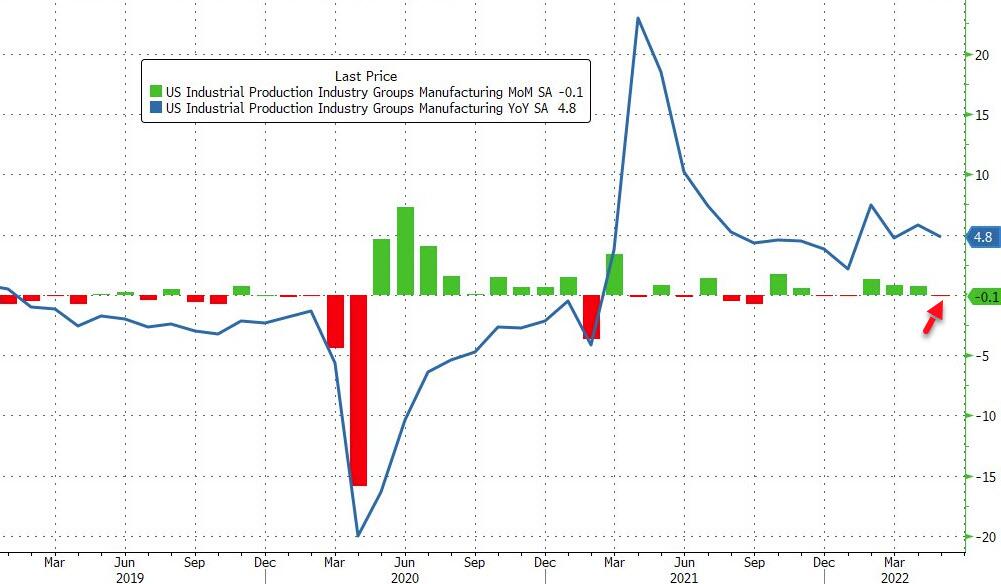
Crude Oil fell back below $110, with Wholesale Gasoline prices following suit, while oil and gas exploration imploded 7.2%, as ZH reported. We also learned that US Manufacturing Output unexpectedly shrank in May.
None of these data indicate an expanding economy, which means, right now we are witnessing the Fed hiking rates into a slowing environment, with yet unknown consequences.
Bond yields were slightly higher for the week but flat for the day with the 10-year making 2 attempts this week to break above its 3.50% level, both of which failed. To me, it’s just a matter of time that this point will be broken and appear in the rearview mirror.
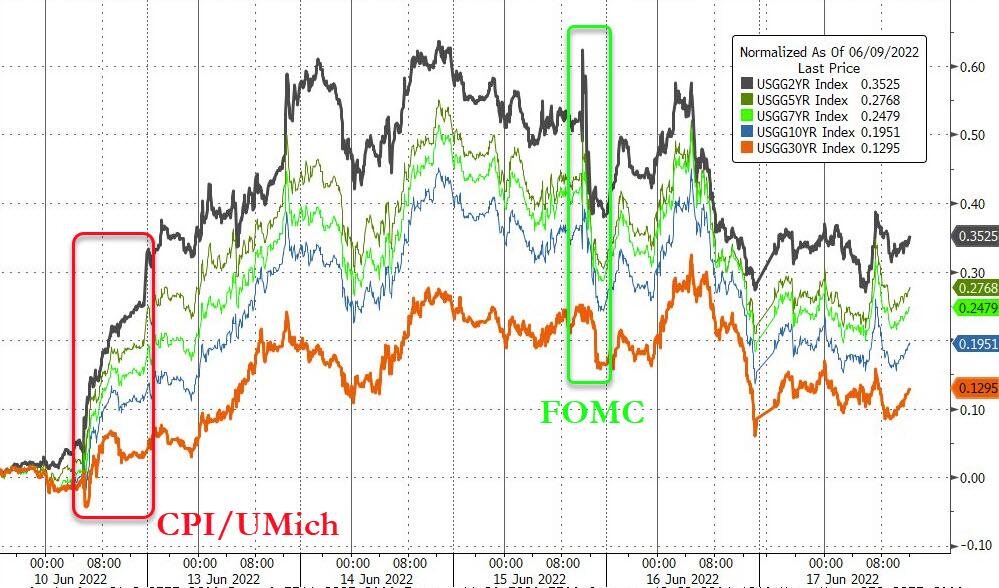
Bloomberg updated its Misery Index, which demonstrates an interesting comparison. However, the bigger misery has happened to the Buy-And-Hold crowd, which does not need an index but must face these ugly numbers:
SPY down -22.80% YTD. TLT (long bond ETF) down -24.6% YTD.
Ouch!
2. ETFs in the Spotlight
In case you missed the announcement and description of this section, you can read it here again.
It features some of the 10 broadly diversified domestic and sector ETFs from my HighVolume list as posted every Saturday. Furthermore, they are screened for the lowest MaxDD% number meaning they have been showing better resistance to temporary sell offs than all others over the past year.
The below table simply demonstrates the magnitude with which these ETFs are fluctuating above or below their respective individual trend lines (%+/-M/A). A break below, represented by a negative number, shows weakness, while a break above, represented by a positive percentage, shows strength.
For hundreds of ETF choices, be sure to reference Thursday’s StatSheet.
For this closed-out domestic “Buy” cycle (2/24/2022), here’s how some of our candidates have fared:
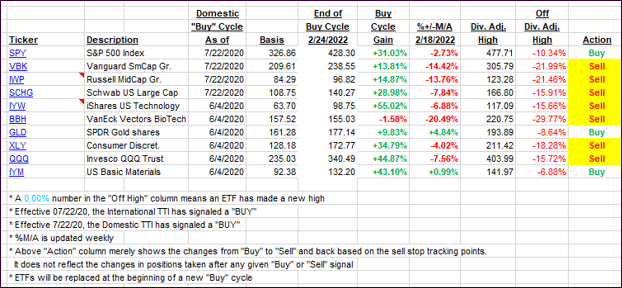
Click image to enlarge.
Again, the %+/-M/A column above shows the position of the various ETFs in relation to their respective long-term trend lines, while the trailing sell stops are being tracked in the “Off High” column. The “Action” column will signal a “Sell” once the -12% point has been taken out in the “Off High” column, which has replaced the prior -8% to -10% limits.
3. Trend Tracking Indexes (TTIs)
Our TTIs were mixed with the Domestic one slightly improving and the International one weakening further.
This is how we closed 06/17/2022:
Domestic TTI: -14.51% below its M/A (prior close -14.99%)—Sell signal effective 02/24/2022.
International TTI: -13.08% below its M/A (prior close -12.44%)—Sell signal effective 03/08/2022.
Disclosure: I am obliged to inform you that I, as well as my advisory clients, own some of the ETFs listed in the above table. Furthermore, they do not represent a specific investment recommendation for you, they merely show which ETFs from the universe I track are falling within the specified guidelines.
All linked charts above are courtesy of Bloomberg via ZeroHedge.
———————————————————-
WOULD YOU LIKE TO HAVE YOUR INVESTMENTS PROFESSIONALLY MANAGED?
Do you have the time to follow our investment plans yourself? If you are a busy professional who would like to have his portfolio managed using our methodology, please contact me directly to get more details.
Contact Ulli