
ETF Tracker StatSheet
You can view the latest version here.
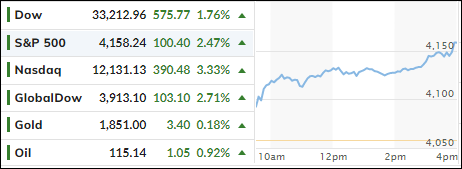
DOW BREAKS OUT OF 8-WEEK SLUMP
- Moving the markets
The major indexes continued their rebound out of oversold territory for the second session and managed to combine two bullish days to finally break the Dow’s eight-week slump, while the S&P 500 and Nasdaq each conquered their seven-week losing streaks.
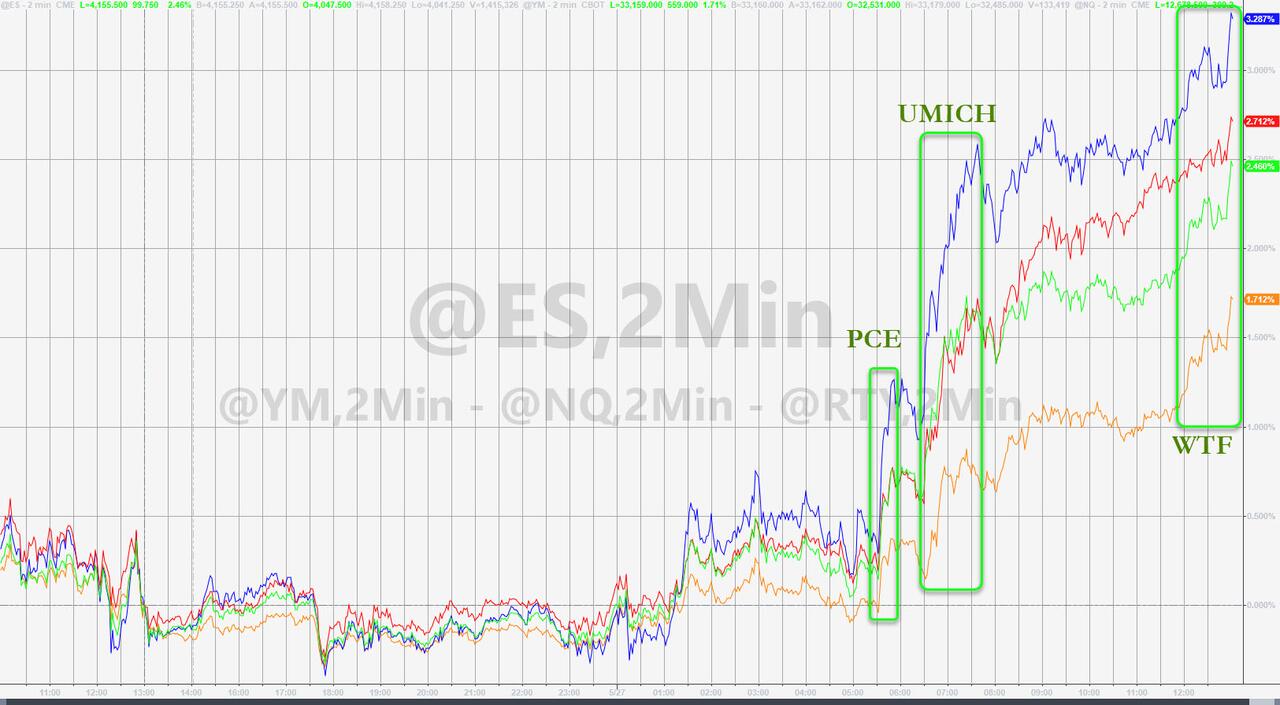
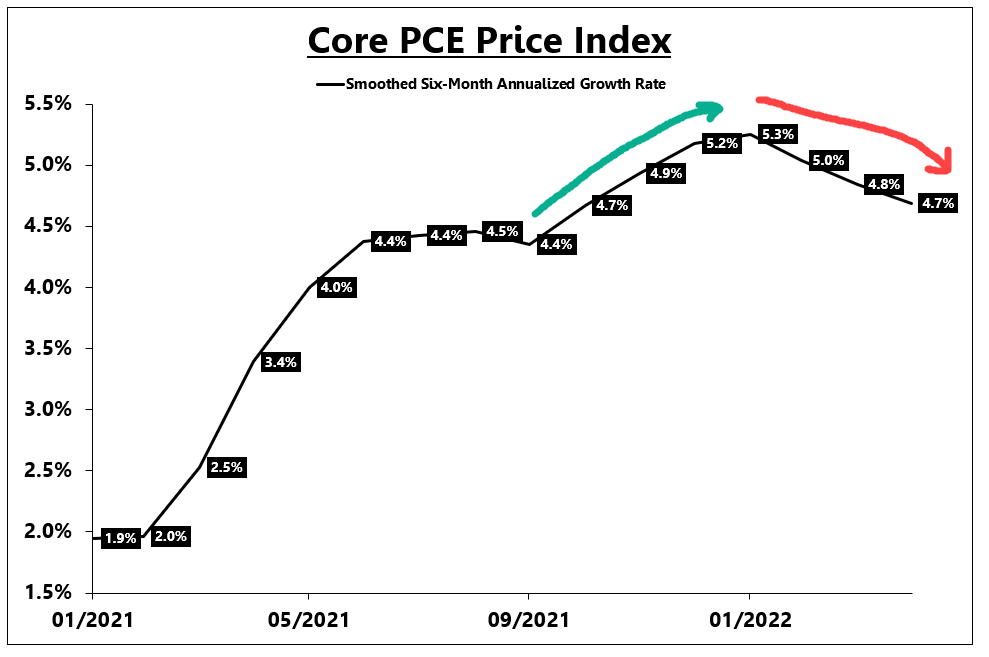
This buying tsunami was unleashed thanks to a PCE (Personal Consumption Expenditure) number in line with expectations. This is the Fed’s favorite index to evaluate the severity of inflation. The core CPE came in on the money, which got the bullish juices flowing, sort of like a relief rally, because the number could have been much worse.
ZeroHedge summed it up best:
And with demand destruction already crippling purchases of airplane tickets after last month’s record surge in air fares (“Runaway Airfare Inflation Is Starting To Cool Demand For Summer Travel, Data Suggests”), expect many more downside surprises in one-time price spikes (if not in food and gas, those are here to stay, but as a reminder, those are non-core prices according to the Fed and as such carry less weight as far as the market is concerned).
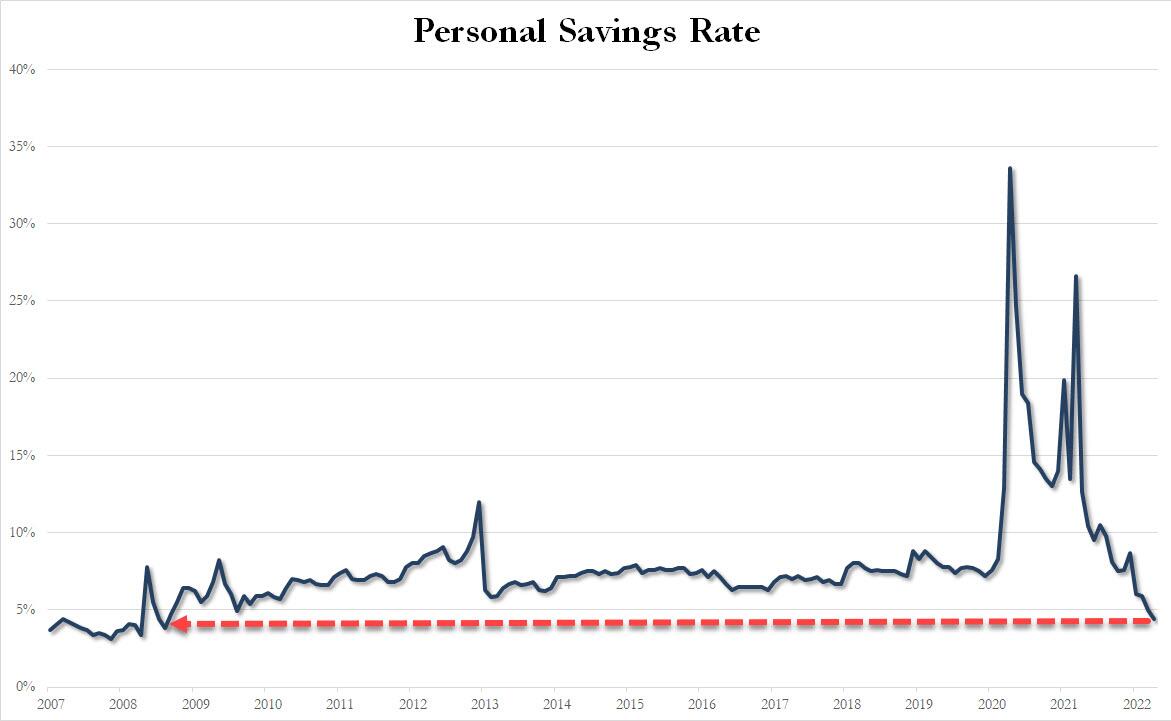
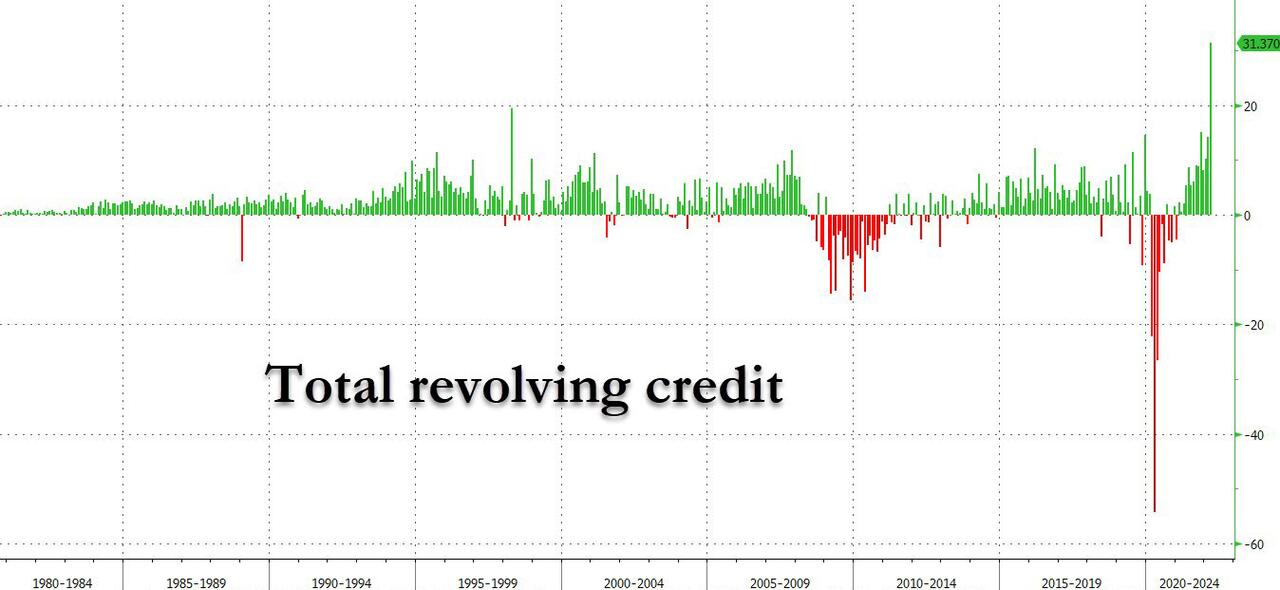
But perhaps the most direct reason why stocks have surged today is because as we noted earlier, the US consumer is officially tapped out: a few weeks after we reported that new credit card debt exploded to the highest level on record, which led us to speculate that US savings – either excess or any other kind – are now gone…
This firmed up traders’ opinions that indeed the Fed will pause its rate hiking efforts in September, which is the #1 reason the markets have spiked and turned from bearish to temporarily bullish. The overriding view is that Fed head Powell will then pull off another “December 2018” event, which ended the horrific slide in stocks and supported a return to the prior bull market.
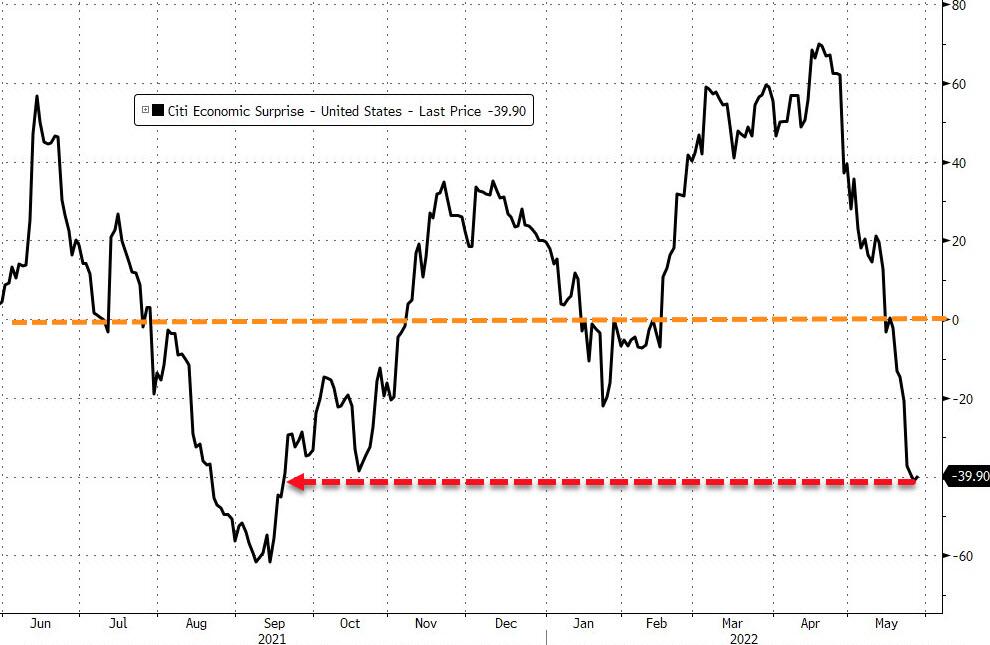
Looking at the big picture, bad news is good news again, as econ data was ugly, yet all Fed speak and rate hike guesses were, at least for today, interpreted as being a positive for the markets. Since last Friday, the Nasdaq, S&P 500 and Dow are up 10%, 9% and 8% respectively, with the latter two now being in the green for the month.
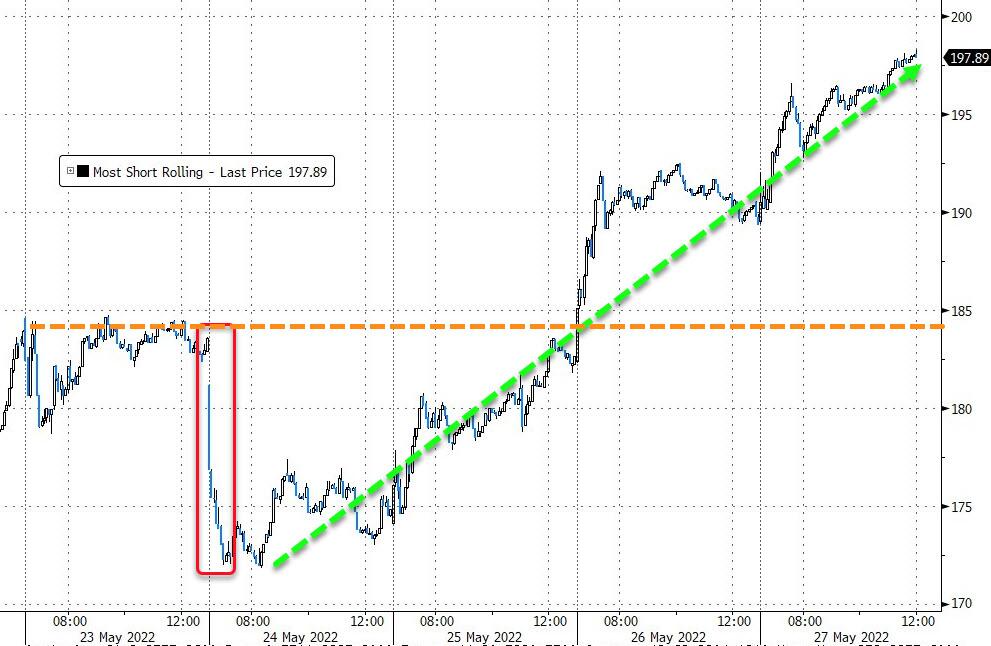
Of course, no bear market rally can materialize without a short squeeze, and this week presented one of mega proportions. Despite this effort, the Nasdaq (QQQ) is still down some 22% YTD, while the S&P 500 (SPY) has done better but remains under water by almost 13%.
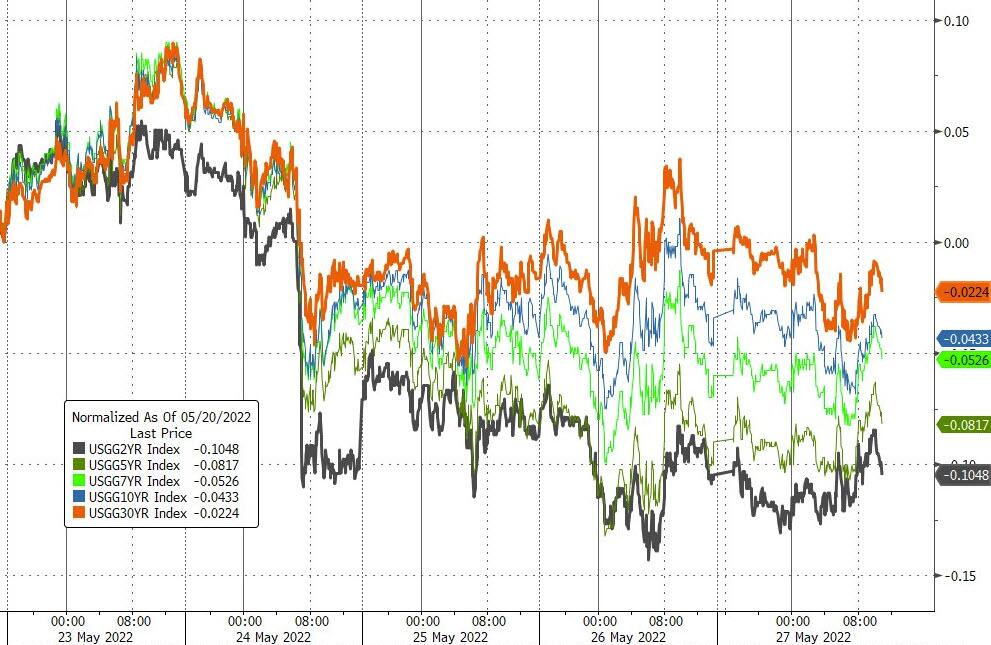
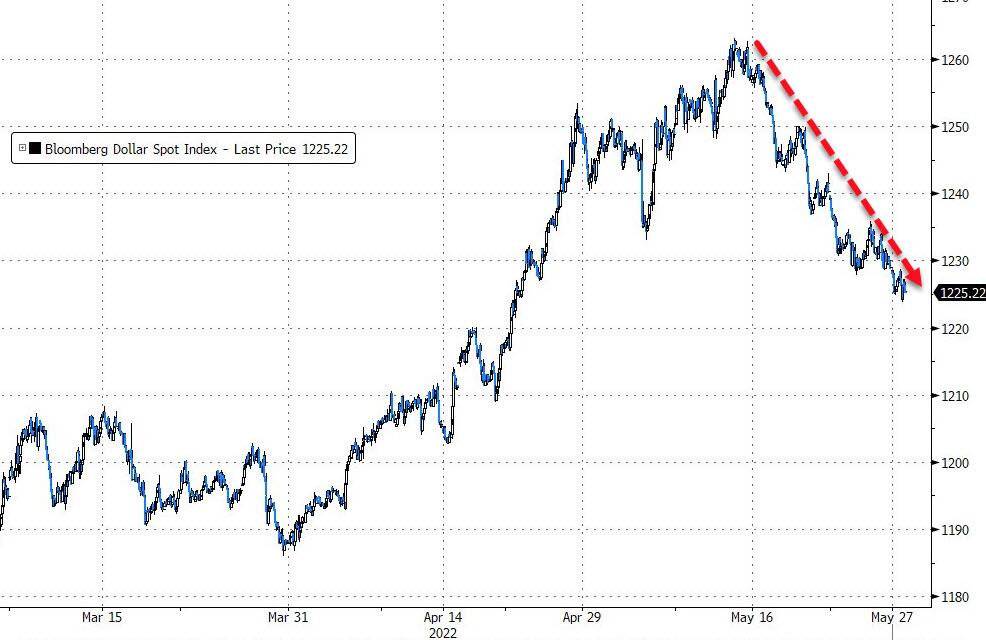
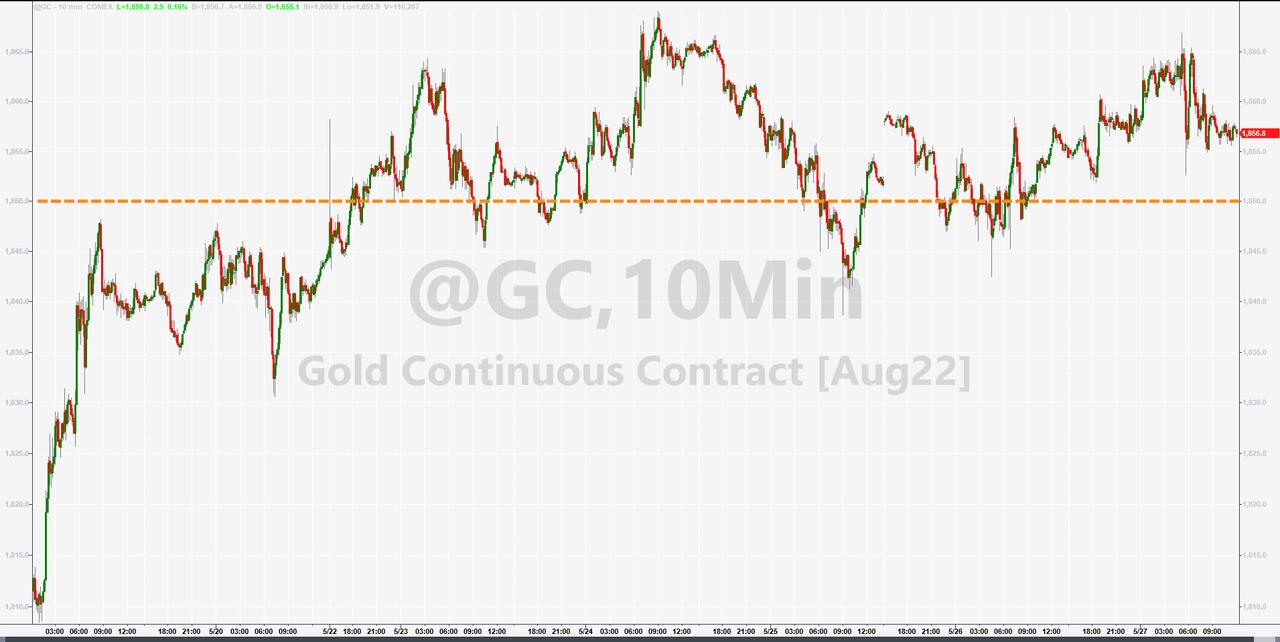
Bond yields drifted lower, the US Dollar dropped for the second week in a row, and precious metals eked out some gains. Financial conditions tightened causing ZeroHedge to ponder:
Will the Fed even hike again?
2. ETFs in the Spotlight
In case you missed the announcement and description of this section, you can read it here again.
It features some of the 10 broadly diversified domestic and sector ETFs from my HighVolume list as posted every Saturday. Furthermore, they are screened for the lowest MaxDD% number meaning they have been showing better resistance to temporary sell offs than all others over the past year.
The below table simply demonstrates the magnitude with which these ETFs are fluctuating above or below their respective individual trend lines (%+/-M/A). A break below, represented by a negative number, shows weakness, while a break above, represented by a positive percentage, shows strength.
For hundreds of ETF choices, be sure to reference Thursday’s StatSheet.
For this closed-out domestic “Buy” cycle (2/24/2022), here’s how some of our candidates have fared:
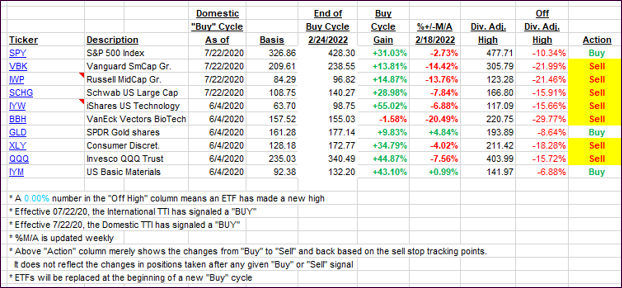
Click image to enlarge.
Again, the %+/-M/A column above shows the position of the various ETFs in relation to their respective long-term trend lines, while the trailing sell stops are being tracked in the “Off High” column. The “Action” column will signal a “Sell” once the -12% point has been taken out in the “Off High” column, which has replaced the prior -8% to -10% limits.
3. Trend Tracking Indexes (TTIs)
Our TTIs stormed higher, as bullish momentum continued despite weak economic data.
This is how we closed 05/27/2022:
Domestic TTI: -2.63% below its M/A (prior close -4.89%)—Sell signal effective 02/24/2022.
International TTI: -3.11% below its M/A (prior close -4.44%)—Sell signal effective 03/08/2022.
Disclosure: I am obliged to inform you that I, as well as my advisory clients, own some of the ETFs listed in the above table. Furthermore, they do not represent a specific investment recommendation for you, they merely show which ETFs from the universe I track are falling within the specified guidelines.
All linked charts above are courtesy of Bloomberg via ZeroHedge.
———————————————————-
WOULD YOU LIKE TO HAVE YOUR INVESTMENTS PROFESSIONALLY MANAGED?
Do you have the time to follow our investment plans yourself? If you are a busy professional who would like to have his portfolio managed using our methodology, please contact me directly or get more details.
Contact Ulli