
ETF Tracker StatSheet
You can view the latest version here.
RAMPING INTO THE WEEKEND
- Moving the markets
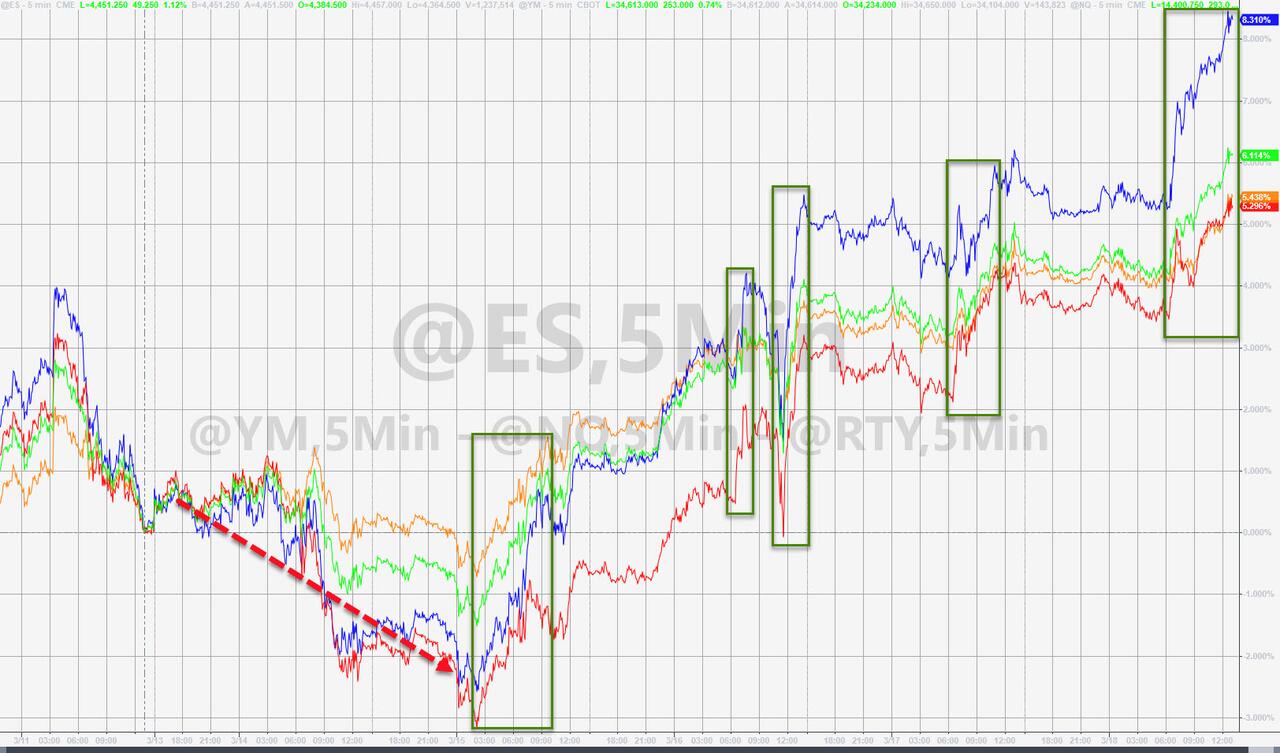
Even in the face of a $3.5 trillion options expirations fest, questionable geopolitical and economic news, along with hawkish tones from Fed Gov Waller, nothing appeared to be able to keep equities from rallying into the weekend, thereby continuing to cut down on YTD losses.
Waller insisted that data were screaming for a half-point rise in rates:
I really favor front-loading our rate hikes, that we need to do more withdrawal of accommodation now if we want to have an impact on inflation later this year and next year,” he told CNBC’s Steve Liesman during a live “Squawk Box” interview.
“So, in that sense, the way to front-load it is to pull some rate hikes forward, which would imply 50 basis points at one or multiple meetings in the near future.”
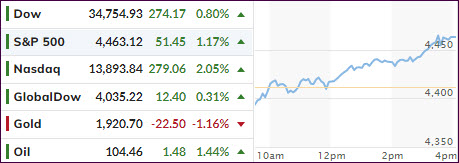
Stocks ignored the hawkish view, and the computer algos pushed the indexes to their best week in 2020, but despite this effort, the broadly held S&P 500 is still down for the year by -6.4%.
We also learned today that Existing Home Sales plunged by a bigger than expected -7.2% MoM in February, as ZH pointed out, which is its biggest MoM drop since May 2020.
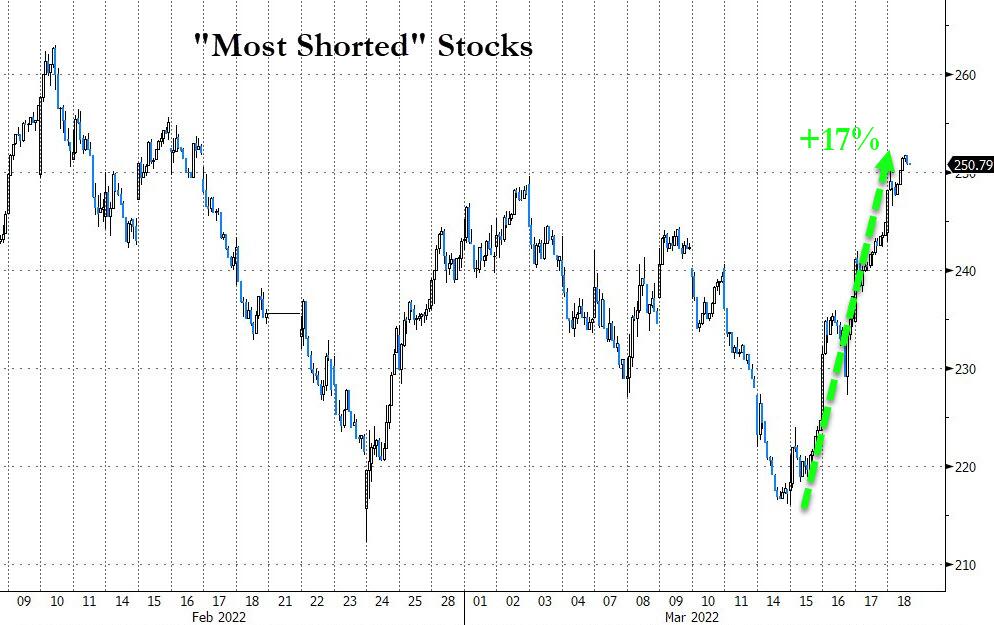
As is always the case, when stocks suddenly explode, a short squeeze is likely part of the manipulation, and this week was no exception, as the most shorted stocks were pushed sharply higher.
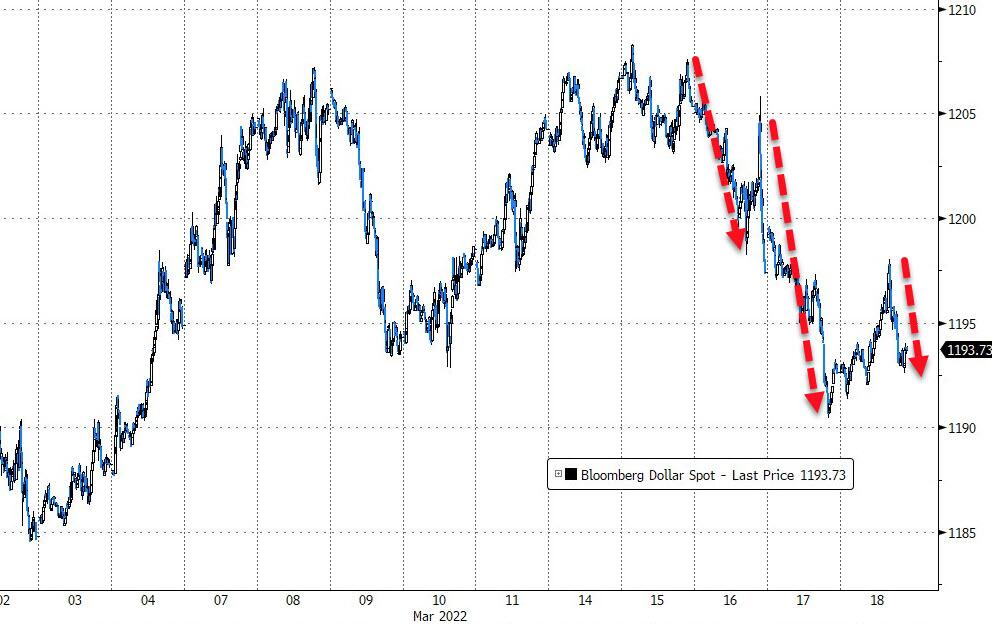
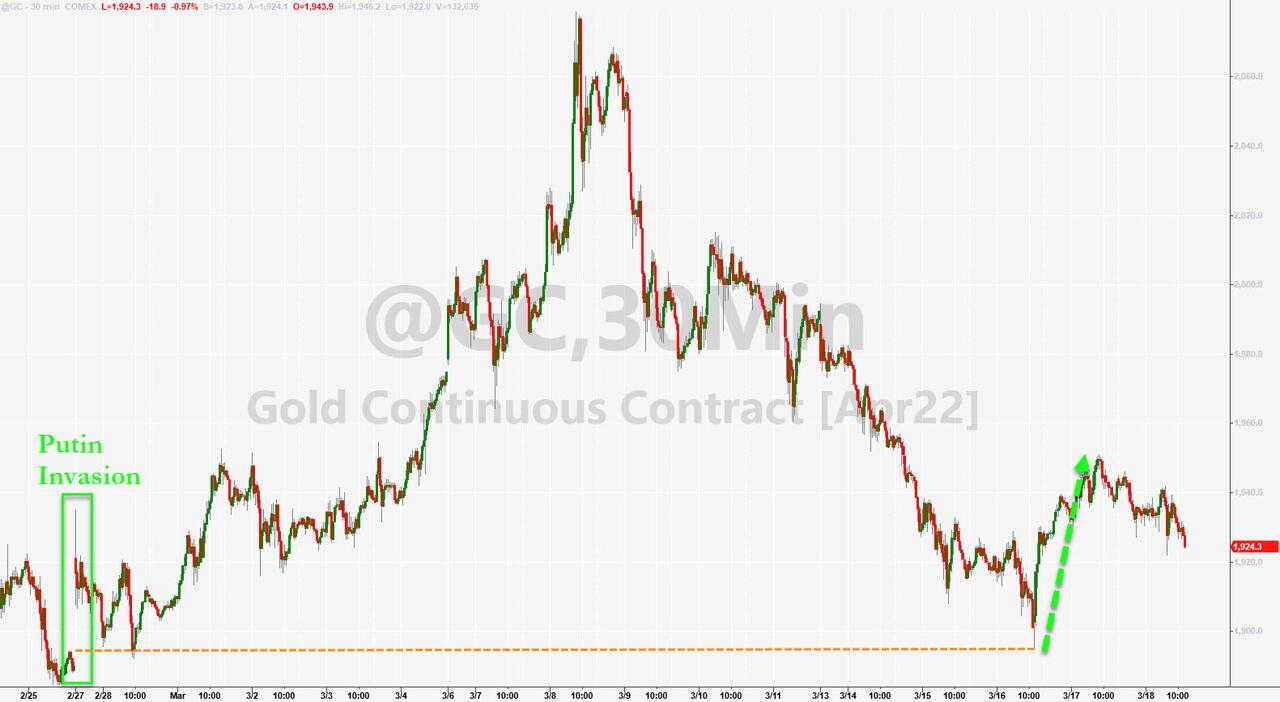
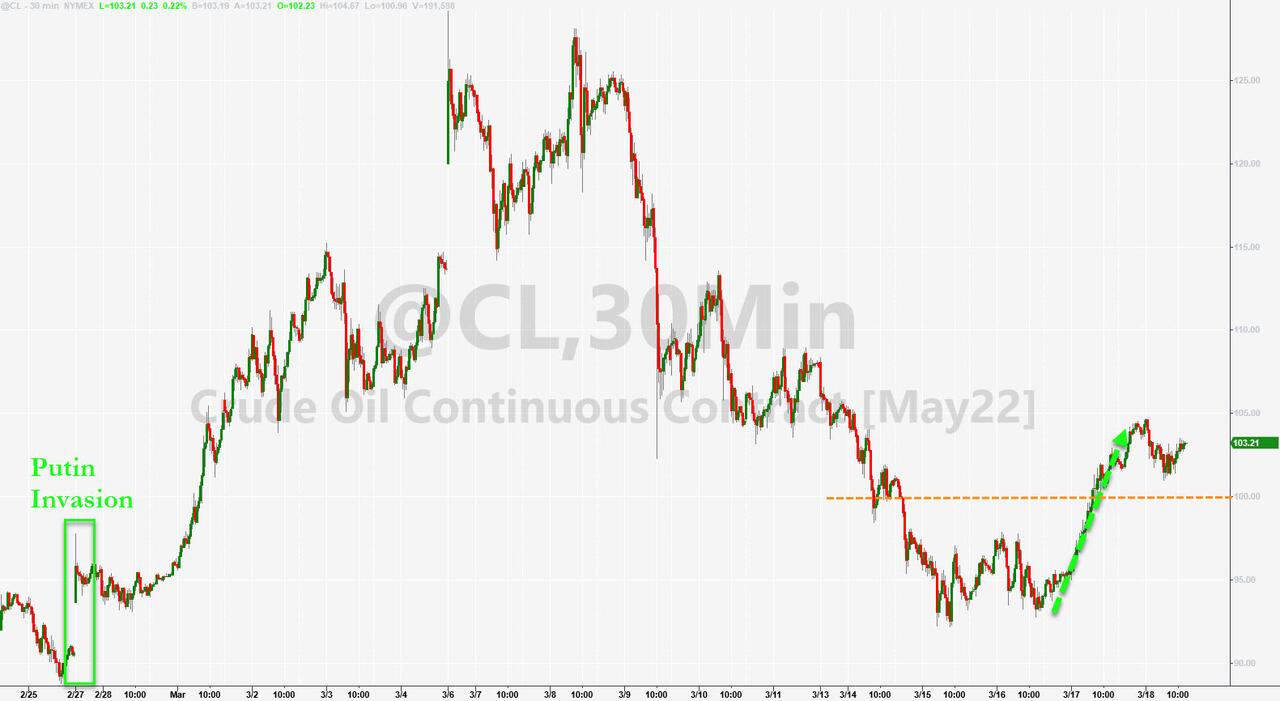
Bond yields rose this week, the US Dollar got hammered, and Gold bounced a few times but sold off today and remains below its $2k level. Crude oil followed a similar pattern but managed to crawl back above its $100 level.
Today’s bounce fest pushed our Domestic Trend Tracking Index (TTI) a tad deeper into bullish territory (section 3 below), which means, absent a drop in the market on Monday, I will start nibbling at adding domestic market exposure.
2 ETFs in the Spotlight
In case you missed the announcement and description of this section, you can read it here again.
It features some of the 10 broadly diversified domestic and sector ETFs from my HighVolume list as posted every Saturday. Furthermore, they are screened for the lowest MaxDD% number meaning they have been showing better resistance to temporary sell offs than all others over the past year.
The below table simply demonstrates the magnitude with which these ETFs are fluctuating above or below their respective individual trend lines (%+/-M/A). A break below, represented by a negative number, shows weakness, while a break above, represented by a positive percentage, shows strength.
For hundreds of ETF choices, be sure to reference Thursday’s StatSheet.
For this just closed-out domestic “Buy” cycle, here’s how some of our candidates have fared:
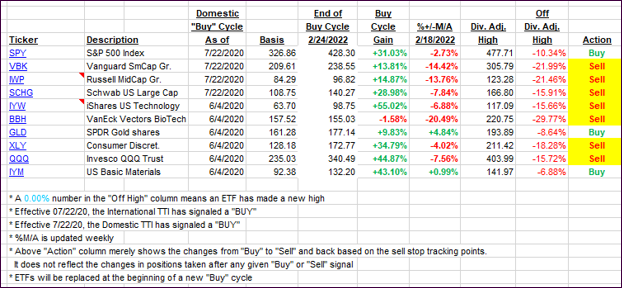
Click image to enlarge.
Again, the %+/-M/A column above shows the position of the various ETFs in relation to their respective long-term trend lines, while the trailing sell stops are being tracked in the “Off High” column. The “Action” column will signal a “Sell” once the -12% point has been taken out in the “Off High” column, which has replaced the prior -8% to -10% limits.
3. Trend Tracking Indexes (TTIs)
Our TTIs both rallied with the Domestic one having now moved a tad deeper into bullish territory. As I said above, in the absence of a market drop on Monday, I will look for exposure in the domestic arena, especially using those ETFs that have recovered the best after the shakeout a few weeks ago.
This is how we closed 03/18/2022:
Domestic TTI: +1.37% above its M/A (prior close +0.92%)—Sell signal effective 02/24/2022.
International TTI: -0.64% below its M/A (prior close -0.94%)—Sell signal effective 03/08/2022.
Disclosure: I am obliged to inform you that I, as well as my advisory clients, own some of the ETFs listed in the above table. Furthermore, they do not represent a specific investment recommendation for you, they merely show which ETFs from the universe I track are falling within the specified guidelines.
All linked charts above are courtesy of Bloomberg via ZeroHedge.
———————————————————-
WOULD YOU LIKE TO HAVE YOUR INVESTMENTS PROFESSIONALLY MANAGED?
Do you have the time to follow our investment plans yourself? If you are a busy professional who would like to have his portfolio managed using our methodology, please contact me directly or get more details.
Contact Ulli