- Moving the markets
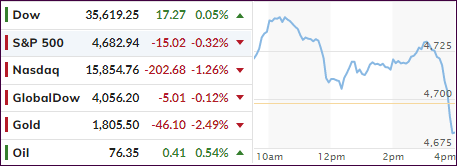
An early rally, supported by Biden’s announcement that he would renominate current Fed chair Powell to continue leading the Federal Reserve over Fed governor Brainard, a more dovish choice, reversed and turned into a puke-a-thon.
MarketWatch explained:
Powell, a former private equity executive, slashed interest rates to near zero and implemented emergency asset purchases in March 2020 to help backstop the market during the first wave of the Covid-19 pandemic, helping the financial system to remain operational during a sharp slowdown in economic activity.
For sure, any change in leadership might have upset worried traders given the volatile environment this country’s economy is in when considering the emergence from Covid as well as inflation levels not seen in some three decades. So, continuity of the known, despite many open questions, appears to be better than changing to an unknown.
After the announcement, bond yields shot up, which took the starch out of a solid rally with the Nasdaq puking the most and heading into the red losing 1.26%. Bank stocks were the beneficiary of higher rates causing the financial sector (XLF) to gain a solid 1.41%.
Even a mid-day short squeeze could not save the major indexes from diving, however, the Dow managed to cling to its unchanged line.
The 10-year yield ripped higher by almost 8 basis point and ended the session at 1.629% with the US Dollar index in hot pursuit and adding 0.5% for the session. That took all upward momentum out of gold, with the precious metal being clubbed and giving back 2.48% but hanging on to its $1,800 level.
It was only a moderate pullback for the indexes, however, when looking under the hood at some prime stocks, the picture turns ugly, as this table by ZeroHedge shows.
It was a session mired in uncertainty ahead of the Thanksgiving Holiday when markets will be closed. On Friday, it will be a short session, and I will not write a market commentary but will prepare Saturday’s “ETFs on the Cutline” and post it on that day.
2. ETFs in the Spotlight
In case you missed the announcement and description of this section, you can read it here again.
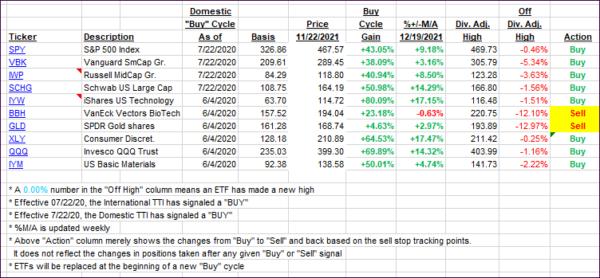
It features some of the 10 broadly diversified domestic and sector ETFs from my HighVolume list as posted every Saturday. Furthermore, they are screened for the lowest MaxDD% number meaning they have been showing better resistance to temporary sell offs than all others over the past year.
The below table simply demonstrates the magnitude with which these ETFs are fluctuating above or below their respective individual trend lines (%+/-M/A). A break below, represented by a negative number, shows weakness, while a break above, represented by a positive percentage, shows strength.
For hundreds of ETF choices, be sure to reference Thursday’s StatSheet.
For this current domestic “Buy” cycle, here’s how some our candidates have fared:

Click image to enlarge.
Again, the %+/-M/A column above shows the position of the various ETFs in relation to their respective long-term trend lines, while the trailing sell stops are being tracked in the “Off High” column. The “Action” column will signal a “Sell” once the -8% point has been taken out in the “Off High” column. For more volatile sector ETFs, the trigger point is -10%.
3. Trend Tracking Indexes (TTIs)
Our TTIs changed slightly and with no consequence to the current bullish theme.
This is how we closed 11/22/2021:
Domestic TTI: +6.41% above its M/A (prior close +6.24%)—Buy signal effective 07/22/2020.
International TTI: +1.66% above its M/A (prior close +1.69%)—Buy signal effective 07/22/2020.
Disclosure: I am obliged to inform you that I, as well as my advisory clients, own some of the ETFs listed in the above table. Furthermore, they do not represent a specific investment recommendation for you, they merely show which ETFs from the universe I track are falling within the specified guidelines.
All linked charts above are courtesy of Bloomberg via ZeroHedge.
Contact Ulli