
ETF Tracker StatSheet
You can view the latest version here.
EARNINGS SEASON POWERS EQUITIES
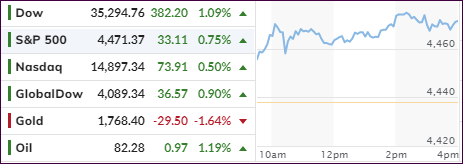
- Moving the markets
Earnings season started with a bang yesterday, after some better-than-expected results unleashed bullish sentiment and sent the major indexes higher. Eight members of the S&P 500 beat Wall Street’s expectations, which set the positive tone for Thursday.
That momentum carried through into today, with Goldman Sachs following the path of other stellar report cards from heavyweights like JPMorgan, BofA, Morgan Stanley and Citigroup, all of which painted a “strong and healthy” picture of the US consumer, as analysts like to call it.
As of today, 80% of the 41 S&P 500 companies that have reported third-quarter results have topped earnings-per-share expectations, according to FactSet.
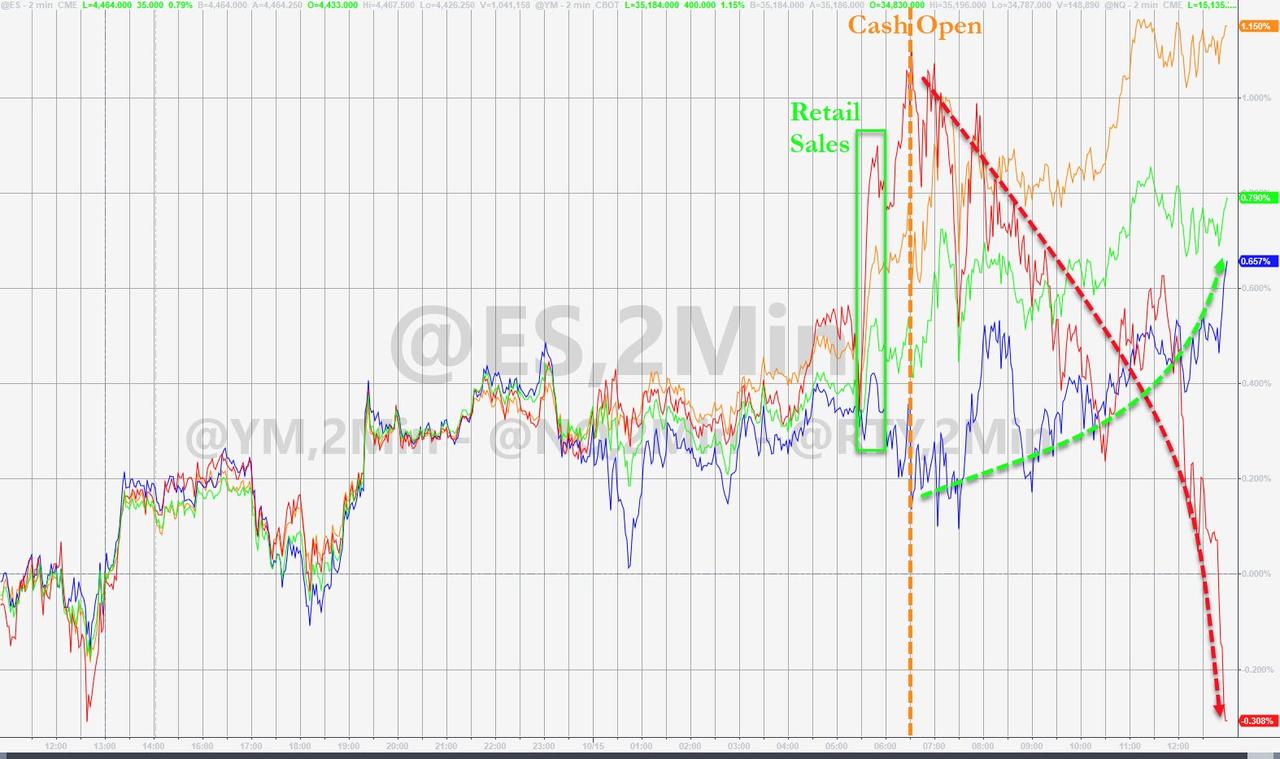
Retail sales surprised to the upside by rising 0.7% vs. economists’ expectations of a 0.2% decline. Obviously, the supply chain interruptions have not put a dent into the retail level. However, fears abound that higher prices will eventually create a fall-off in demand.
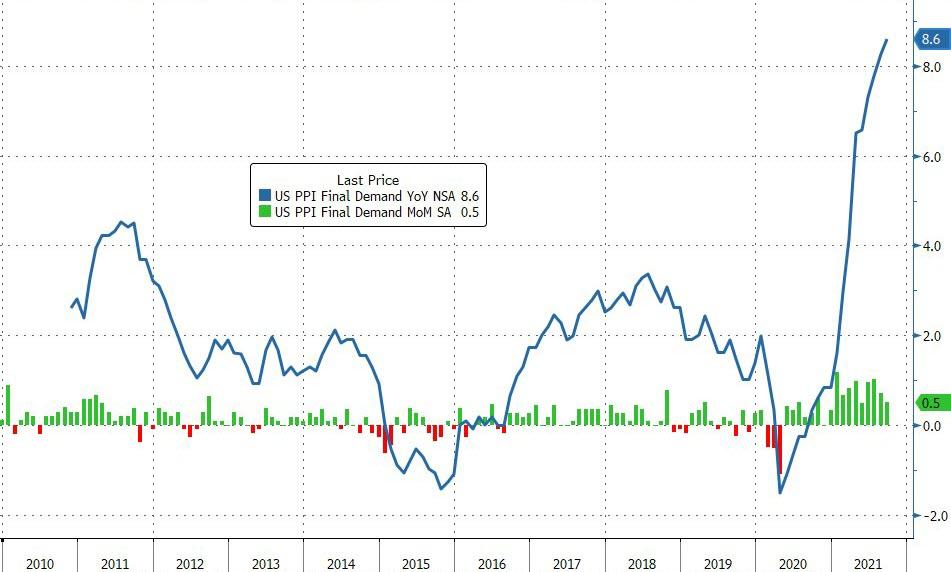
That will be in the cards sooner or later, as the Producer Price Index (PPI) accelerated into record territory, as ZeroHedge reported, by jumping +0.5% MoM to a new record of +8.6% YoY. This was against higher expectations of +0.6% MoM and +8.7% YoY.
Today’s rally was broad based with SmallCaps being the exception, when that sector, after an early bounce, swan dived and closed in the red. Quite a divergence, as this chart demonstrates.
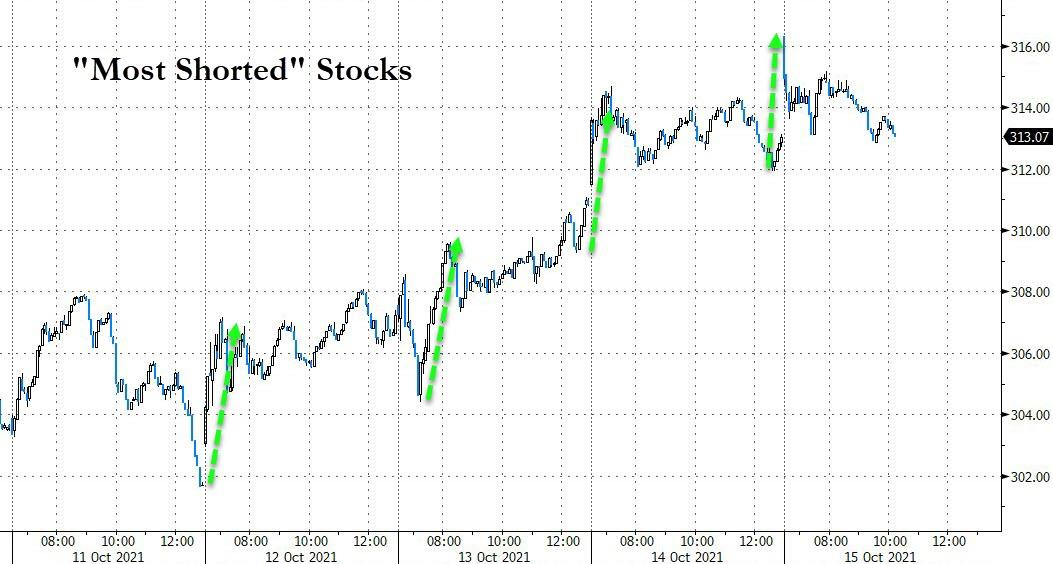
And, as we’ve seen all week, an early well-timed short squeeze contributed to get upward momentum started during the past four trading sessions, but eventually the short-squeezers ran out of ammo, as ZeroHedge called it.
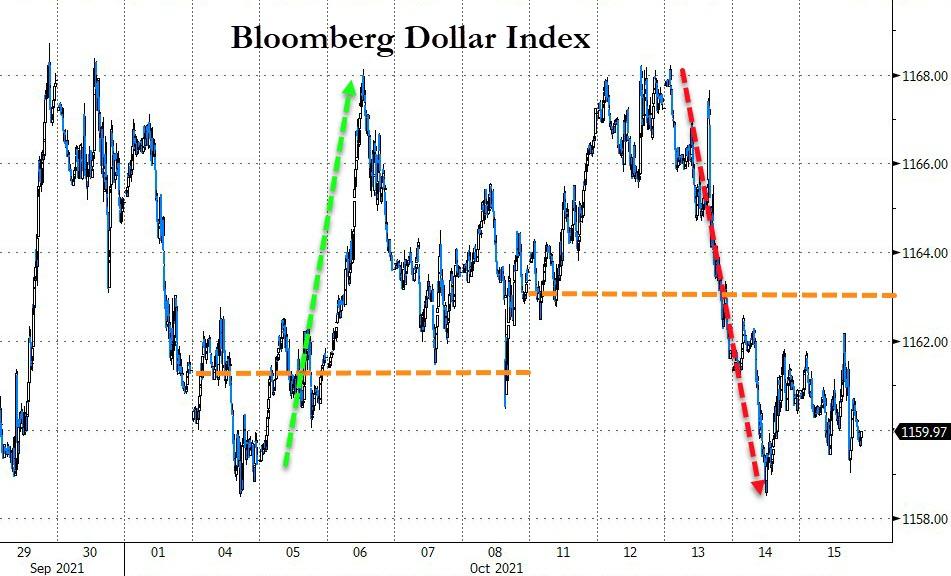
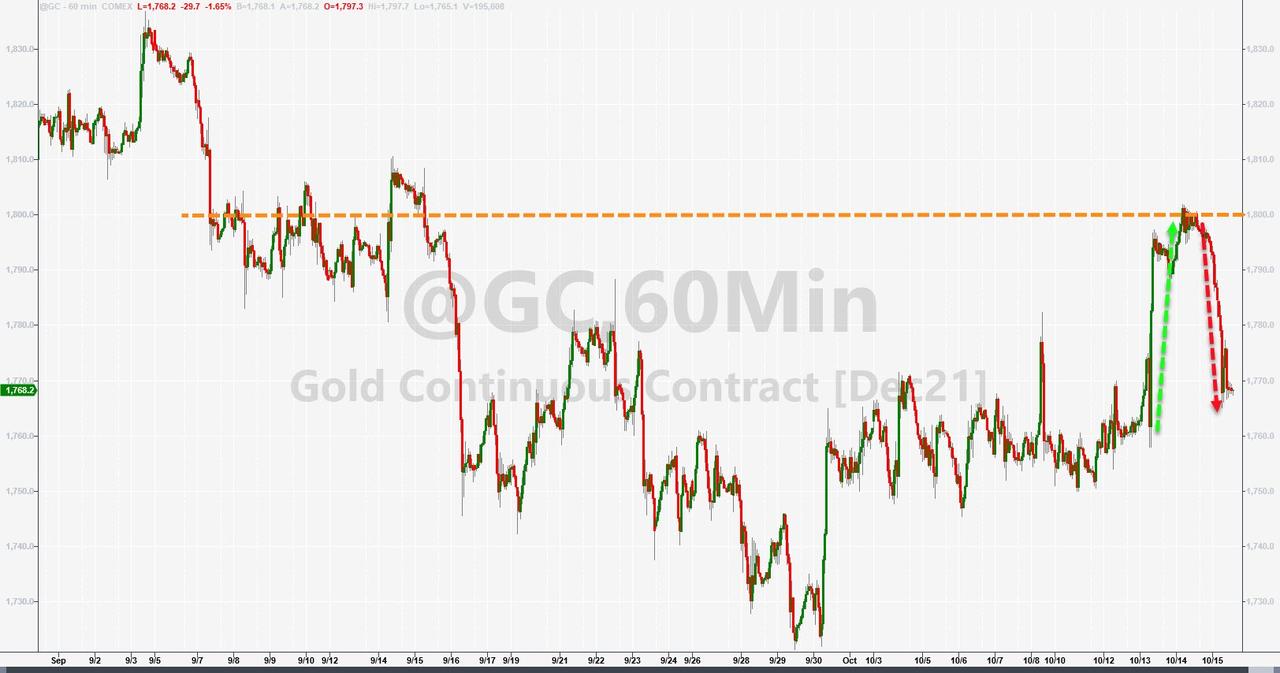
The US Dollar, after plunging two days in a row, found some footing and managed a mid-day rebound, which ran out of steam near the close. Bond yields rose with the 10-year spiking to 1.575%, which took the starch out of gold’s rally and made the $1,800 a tough number to conquer resulting in the precious metal to give back its recent gains.
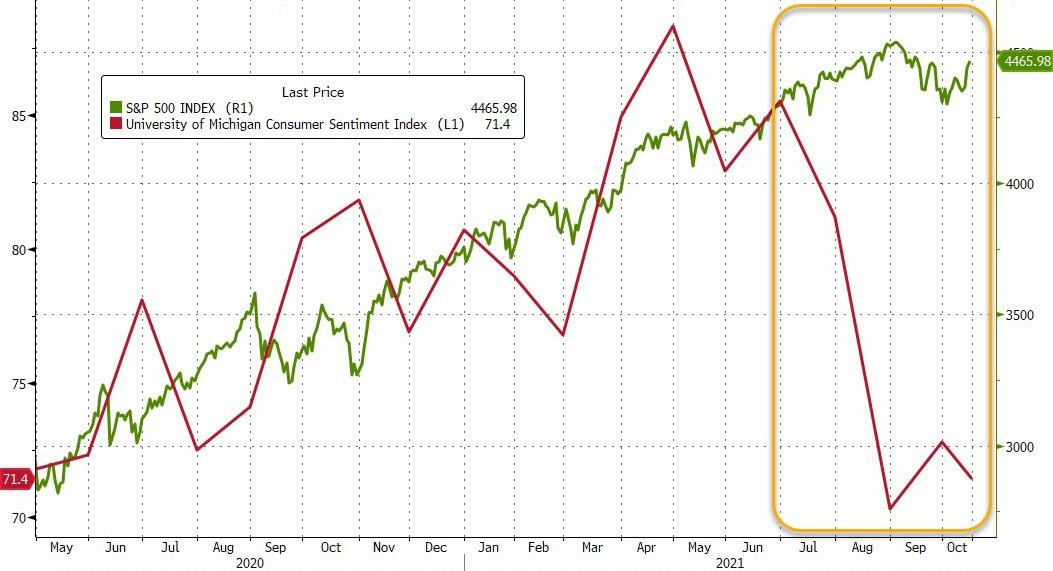
The not so funny part about this rally is that, despite the indexes racing back towards all-time highs, Consumer Sentiment showed its second lowest level in a decade, as Bloomberg via ZH demonstrates in this chart. Go figure…
2. ETFs in the Spotlight
In case you missed the announcement and description of this section, you can read it here again.
It features some of the 10 broadly diversified domestic and sector ETFs from my HighVolume list as posted every Saturday. Furthermore, they are screened for the lowest MaxDD% number meaning they have been showing better resistance to temporary sell offs than all others over the past year.
The below table simply demonstrates the magnitude with which these ETFs are fluctuating above or below their respective individual trend lines (%+/-M/A). A break below, represented by a negative number, shows weakness, while a break above, represented by a positive percentage, shows strength.
For hundreds of ETF choices, be sure to reference Thursday’s StatSheet.
For this current domestic “Buy” cycle, here’s how some our candidates have fared:
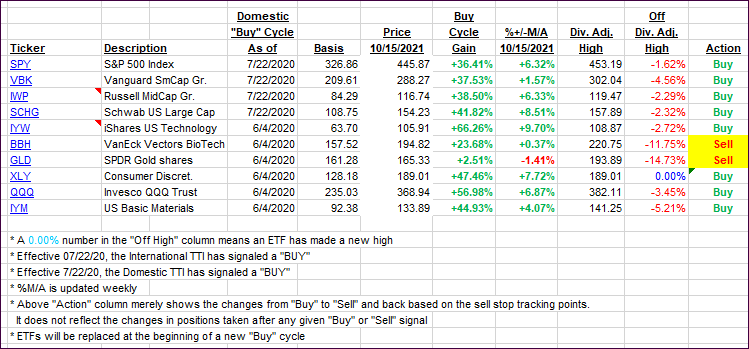
Click image to enlarge.
Again, the %+/-M/A column above shows the position of the various ETFs in relation to their respective long-term trend lines, while the trailing sell stops are being tracked in the “Off High” column. The “Action” column will signal a “Sell” once the -8% point has been taken out in the “Off High” column. For more volatile sector ETFs, the trigger point is -10%.
3. Trend Tracking Indexes (TTIs)
Our TTIs were mixed with the Domestic one inching back a tad, though the International one gained.
This is how we closed 10/15/2021:
Domestic TTI: +6.24% above its M/A (prior close +6.36%)—Buy signal effective 07/22/2020.
International TTI: +4.13% above its M/A (prior close +3.55%)—Buy signal effective 07/22/2020.
Disclosure: I am obliged to inform you that I, as well as my advisory clients, own some of the ETFs listed in the above table. Furthermore, they do not represent a specific investment recommendation for you, they merely show which ETFs from the universe I track are falling within the specified guidelines.
All linked charts above are courtesy of Bloomberg via ZeroHedge.
———————————————————-
WOULD YOU LIKE TO HAVE YOUR INVESTMENTS PROFESSIONALLY MANAGED?
Do you have the time to follow our investment plans yourself? If you are a busy professional who would like to have his portfolio managed using our methodology, please contact me directly or get more details here.
Contact Ulli