
- Moving the markets
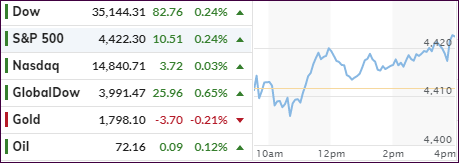
Touching new all-time highs seems to be a regular occurrence, and today was no exception with the S&P 500 hovering again in record territory.
That came as a surprise, as in overnight trading the Chinese tech stocks were a bloodbath again, as Beijing’s crackdown intensified. So far, the US markets seem to be ignoring it and continue dancing to the beat of their own drummer.
Expectations are that, with the busiest earnings week on deck, results will remain market pleasing hence the run higher ahead of actual outcomes. The well-known adage “buy the rumor, sell the fact,” may be proven correct again.
Despite jawboning to the contrary, the economic recovery remains doubtful at best with sales of US single family homes dropping unexpectedly in June, falling 6.6% to a seasonally adjusted rate of 676k units vs. expectations of an increase to 795k units.
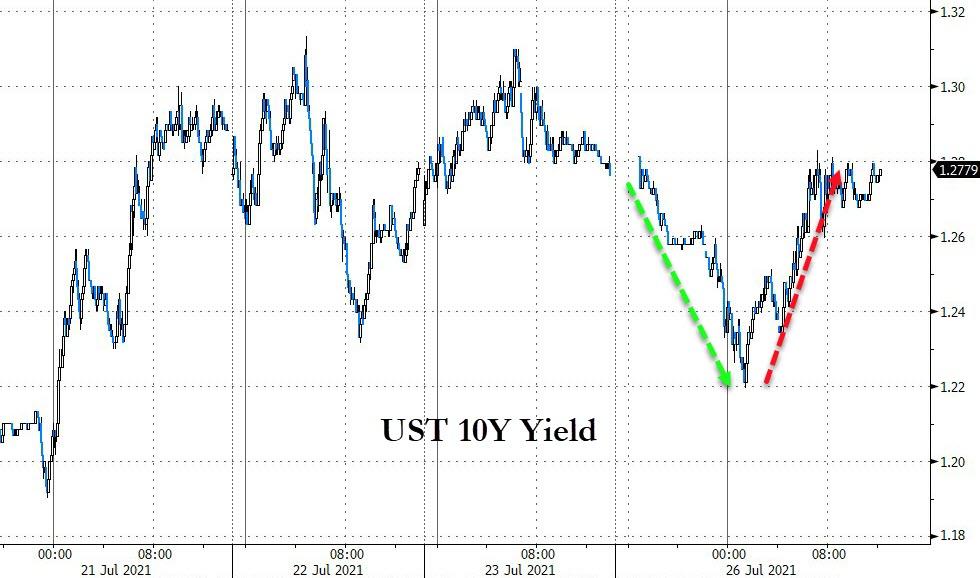
In terms of market behavior, we saw the US Dollar index slipping, along with Small Caps, while value (RPV) outperformed with a +0.94% gain. The 10-year bond yield did its own interpretation of a roller coaster ride but ended unchanged.
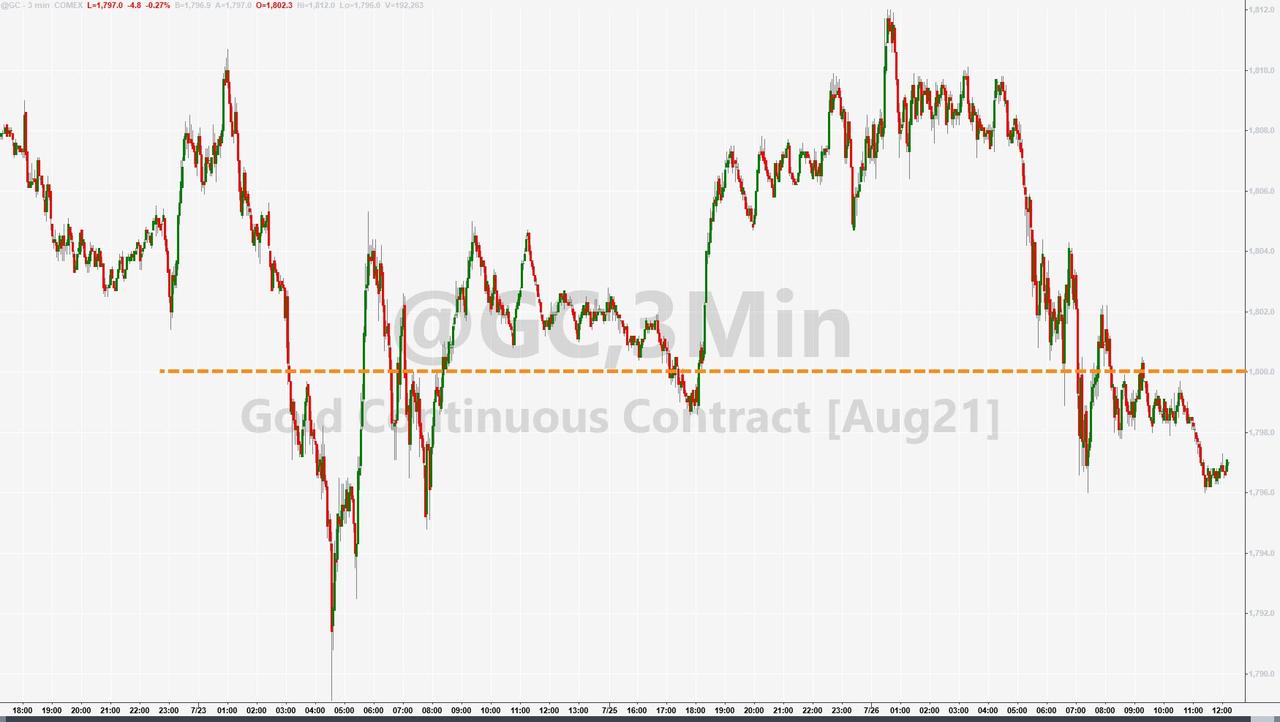
Gold struggled all day and lost its $1,800 level, but only by a small margin with even collapsing yields not being able to prop up the precious metal. The Nasdaq just about broke even, but that may change with some of the tech titans report cards waiting on deck.
2. ETFs in the Spotlight
In case you missed the announcement and description of this section, you can read it here again.
It features some of the 10 broadly diversified domestic and sector ETFs from my HighVolume list as posted every Saturday. Furthermore, they are screened for the lowest MaxDD% number meaning they have been showing better resistance to temporary sell offs than all others over the past year.
The below table simply demonstrates the magnitude with which these ETFs are fluctuating above or below their respective individual trend lines (%+/-M/A). A break below, represented by a negative number, shows weakness, while a break above, represented by a positive percentage, shows strength.
For hundreds of ETF choices, be sure to reference Thursday’s StatSheet.
For this current domestic “Buy” cycle, here’s how some our candidates have fared:
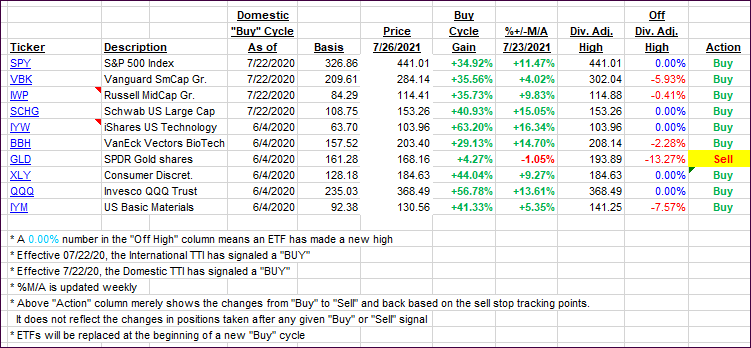
Click image to enlarge.
Again, the %+/-M/A column above shows the position of the various ETFs in relation to their respective long-term trend lines, while the trailing sell stops are being tracked in the “Off High” column. The “Action” column will signal a “Sell” once the -8% point has been taken out in the “Off High” column. For more volatile sector ETFs, the trigger point is -10%.
3. Trend Tracking Indexes (TTIs)
Our TTIs edged higher in sync with the broad indexes.
This is how we closed 07/26/2021:
Domestic TTI: +10.87% above its M/A (prior close +10.56%)—Buy signal effective 07/22/2020.
International TTI: +7.15% above its M/A (prior close +6.47%)—Buy signals effective 07/22/2020.
Disclosure: I am obliged to inform you that I, as well as my advisory clients, own some of the ETFs listed in the above table. Furthermore, they do not represent a specific investment
recommendation for you, they merely show which ETFs from the universe I track are falling within the specified guidelines.
All linked charts above are courtesy of Bloomberg via ZeroHedge.
Contact Ulli