
ETF Tracker StatSheet
You can view the latest version here.
GAINING ALTITUDE
- Moving the markets
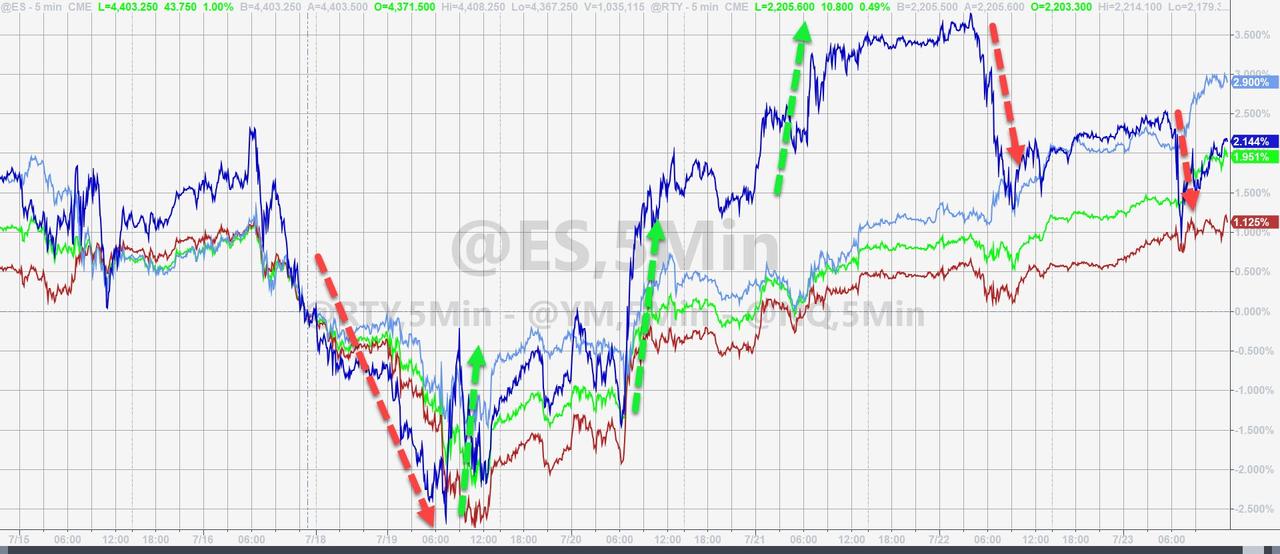
After Monday’s dump, which by now has long been forgotten, the bulls stepped up to the plate with the major indexes scoring four winning days in a row along with record closes.
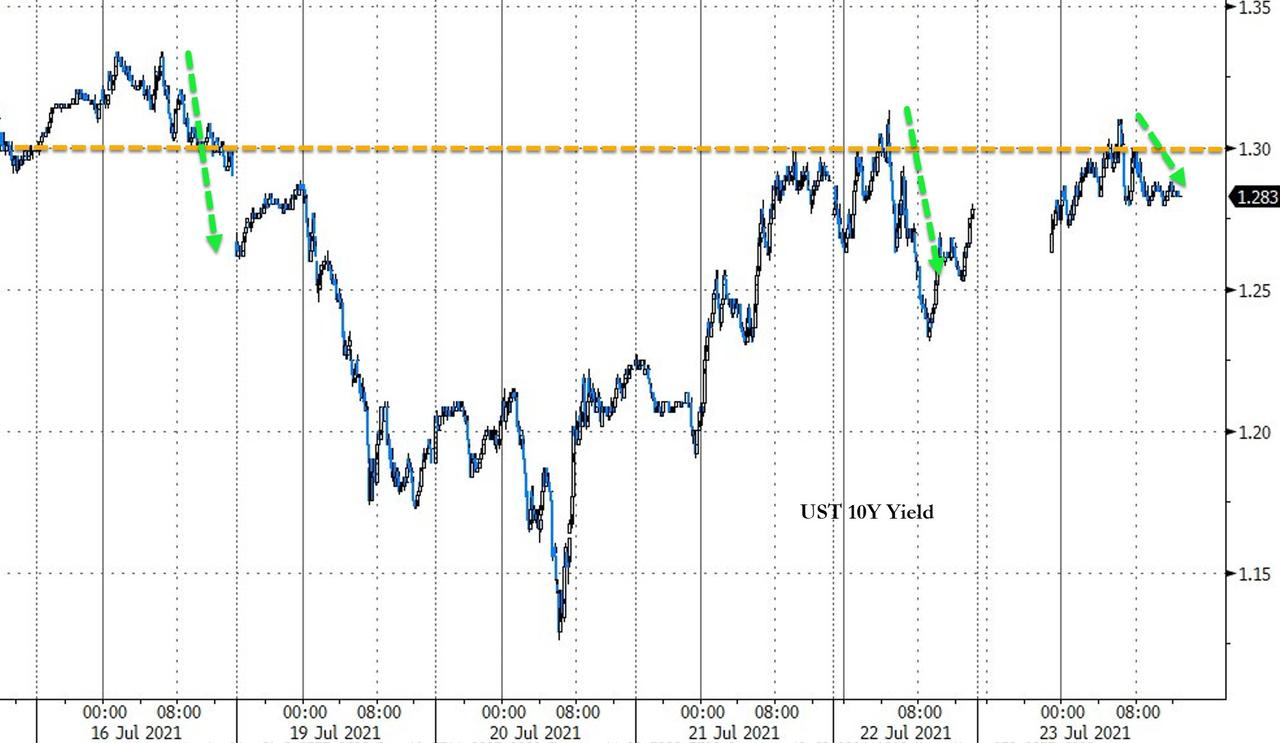
The overpowering economic concerns from earlier in the week gave way to unbridled optimism, as bond yields rose from a five-month low of 1.13% for the 10-year to a current 1.285%. Traders took that as sign that things were overblown, and that inflation does not appear to be as much of a threat as it had been in the 70’s and 80’s, a viewpoint that I disagree with.
Be that as it may, right now the bulls are in charge with additional support coming from strong earnings in the tech sector with 88% of all S&P 500 members having reported a positive surprise. That is the highest percentage since 2008, if that figure holds throughout this earning season, according to FactSet.
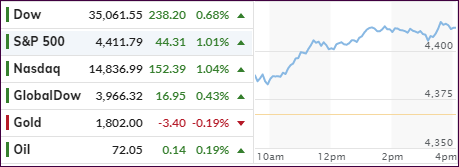
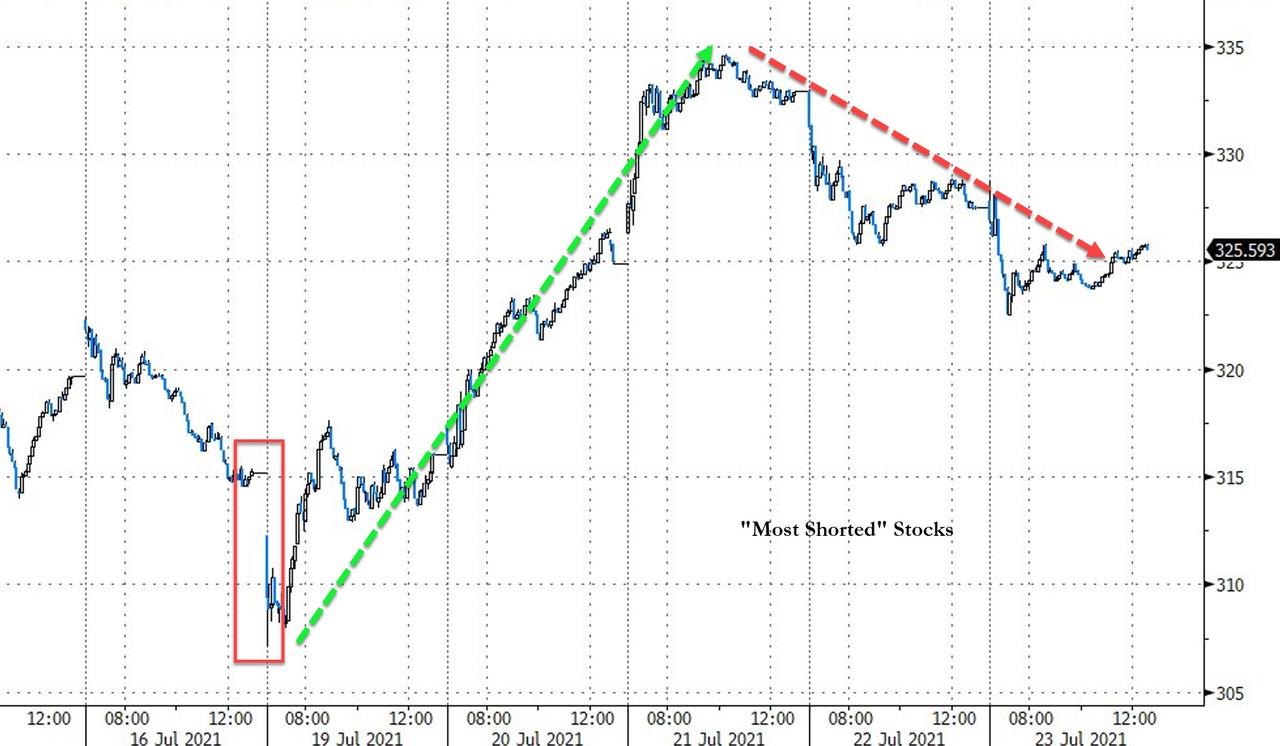
The short squeeze of the first three trading days faded and had no effect over the past two sessions. Bond yields meandered on the day with the 10-year creeping above the 1.30% marker but failed to hold that level. Gold slipped a tad but managed to hang on to the $1,800 level, while the US Dollar Index trod water.
Given the horrific start of the major indexes to this week, ending up with +1.95% for the S&P 500, +2.8% for the Nasdaq and +1% for the Dow is a recovery worth remembering.
2. ETFs in the Spotlight
In case you missed the announcement and description of this section, you can read it here again.
It features some of the 10 broadly diversified domestic and sector ETFs from my HighVolume list as posted every Saturday. Furthermore, they are screened for the lowest MaxDD% number meaning they have been showing better resistance to temporary sell offs than all others over the past year.
The below table simply demonstrates the magnitude with which these ETFs are fluctuating above or below their respective individual trend lines (%+/-M/A). A break below, represented by a negative number, shows weakness, while a break above, represented by a positive percentage, shows strength.
For hundreds of ETF choices, be sure to reference Thursday’s StatSheet.
For this current domestic “Buy” cycle, here’s how some our candidates have fared:
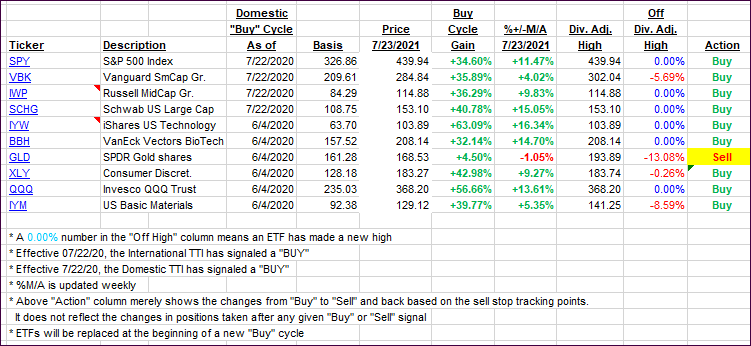
Click image to enlarge.
Again, the %+/-M/A column above shows the position of the various ETFs in relation to their respective long-term trend lines, while the trailing sell stops are being tracked in the “Off High” column. The “Action” column will signal a “Sell” once the -8% point has been taken out in the “Off High” column. For more volatile sector ETFs, the trigger point is -10%.
3. Trend Tracking Indexes (TTIs)
Our TTIs were mixed with the Domestic one advancing and the International one declining slightly.
This is how we closed 07/23/2021:
Domestic TTI: +10.56% above its M/A (prior close +10.44%)—Buy signal effective 07/22/2020.
International TTI: +6.47% above its M/A (prior close +6.63%)—Buy signals effective 07/22/2020.
Disclosure: I am obliged to inform you that I, as well as my advisory clients, own some of the ETFs listed in the above table. Furthermore, they do not represent a specific investment
recommendation for you, they merely show which ETFs from the universe I track are falling within the specified guidelines.
All linked charts above are courtesy of Bloomberg via ZeroHedge.
———————————————————-
WOULD YOU LIKE TO HAVE YOUR INVESTMENTS PROFESSIONALLY MANAGED?
Do you have the time to follow our investment plans yourself? If you are a busy professional who would like to have his portfolio managed using our methodology, please contact me directly or get more details here.
———————————————————
Back issues of the ETF Tracker are available on the web.
Contact Ulli