- Moving the markets
Following yesterday’s plunge into the close, the bulls found no reason to support the major indexes at the opening today, as they handed the baton to the bears.
Despite dip buyers stepping up to the plate late in the day, there was simply not enough motivation present to drive the indexes back into the green, however, the much-battered Nasdaq came within striking distance.
In the end, today turned into another wild ride with losses being reduced, as a modest rebound attempt soothed traders’ raw nerves. Even though the Nasdaq came close to breakeven, it has fallen nearly 5% in May due to fears of inflation having deepened.
The release of the Fed minutes was on deck today and included the surprise message that “a strong pick up in economic activity would warrant discussion of tightening monetary policy in the coming months.”
Here is the exact wording:
“A number of participants suggested that if the economy continued to make rapid progress toward the Committee’s goals, it might be appropriate at some point in upcoming meetings to begin discussing a plan for adjusting the pace of asset purchases.”
That’s not what traders wanted to hear, since any hint of tightening translates into higher bond yields and subsequently lower stock prices. As a result, Fed head Powell came out after the meeting and tried to soften the blow a little by stating:
The recovery remains “uneven and far from complete” and the economy was still not showing the “substantial further progress” standard the committee has set before it will change policy.
Consequently, the US Dollar went vertical, as the Fed’s taper talk made headlines, and bond yields surged put pulled back slightly into the close. Both actions took the early starch out of gold, but the precious metal still managed to eke out a 0.18% gain.
Volatility has been on the rise, as has uncertainty in the trading community, and it is only Wednesday. Could we see a repeat of last week’s sequence, when the last two trading days appeased the bulls and wiped out most of the losses of the first three?
2. ETFs in the Spotlight
In case you missed the announcement and description of this section, you can read it here again.
It features some of the 10 broadly diversified domestic and sector ETFs from my HighVolume list as posted every Saturday. Furthermore, they are screened for the lowest MaxDD% number meaning they have been showing better resistance to temporary sell offs than all others over the past year.
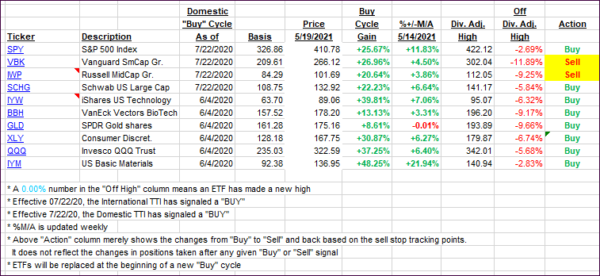
The below table simply demonstrates the magnitude with which these ETFs are fluctuating above or below their respective individual trend lines (%+/-M/A). A break below, represented by a negative number, shows weakness, while a break above, represented by a positive percentage, shows strength.
For hundreds of ETF choices, be sure to reference Thursday’s StatSheet.
For this current domestic “Buy” cycle, here’s how some our candidates have fared:

Click image to enlarge.
Again, the %+/-M/A column above shows the position of the various ETFs in relation to their respective long-term trend lines, while the trailing sell stops are being tracked in the “Off High” column. The “Action” column will signal a “Sell” once the -8% point has been taken out in the “Off High” column. For more volatile sector ETFs, the trigger point is -10%.
3. Trend Tracking Indexes (TTIs)
Our TTIs slipped in unison as the bears ruled today’s session.
This is how we closed 05/19/2021:
Domestic TTI: +16.54% above its M/A (prior close +17.15%)—Buy signal effective 07/22/2020.
International TTI: +15.13% above its M/A (prior close +16.45%)—Buy signals effective 07/22/2020.
Disclosure: I am obliged to inform you that I, as well as my advisory clients, own some of the ETFs listed in the above table. Furthermore, they do not represent a specific investment recommendation for you, they merely show which ETFs from the universe I track are falling within the specified guidelines.
All linked charts above are courtesy of Bloomberg via ZeroHedge.
Contact Ulli