
- Moving the markets
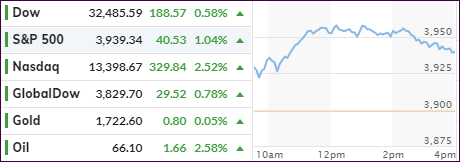
The futures markets already pointed to higher prices for the Nasdaq, which had fallen as much as 12% last week before attempting a comeback. Today, it was the leader among the major indexes sporting +2.52%, while the Dow and S&P 500 lagged with gains of +0.58% and +1.04% respectively but both hit new intraday highs.
CNBC described the rebound this way:
Tech and growth stocks are rebounding from a swift correction triggered by rising interest rates. Higher rates make profits in far-off years seem less attractive to investors and can knock down stocks with relatively high valuations.
In economic news we learned that January job openings spiked by 165k to 6.917 million, the highest level since the pre-covid highs of February when there were just over 7 million job openings, according to ZH.
Better than expected weekly jobless claims, 712k vs. 725k, cheered on traders and, while this is an improvement, it is nevertheless a sorry situation to see some 700k-800k of new claims occurring week after week.
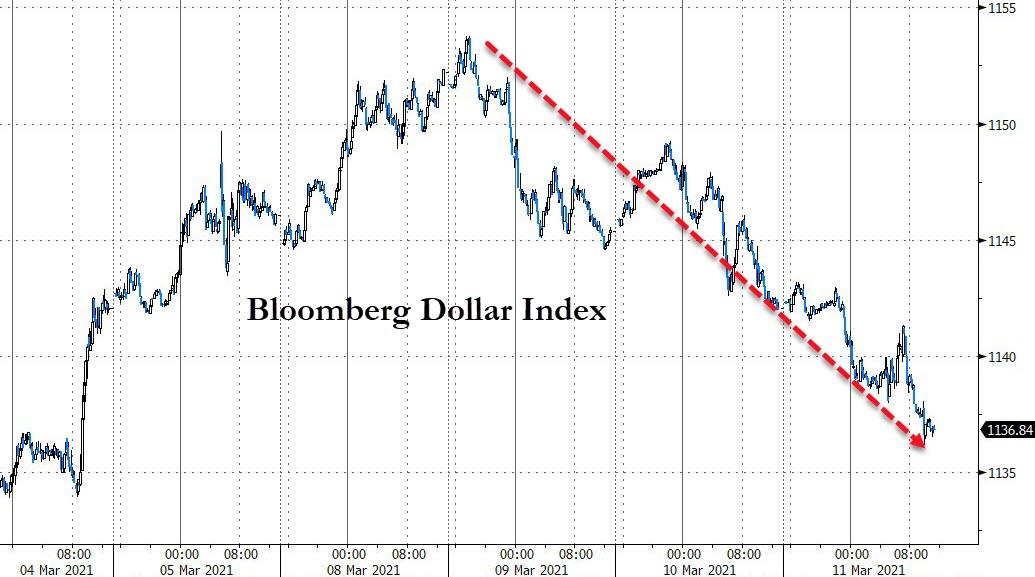
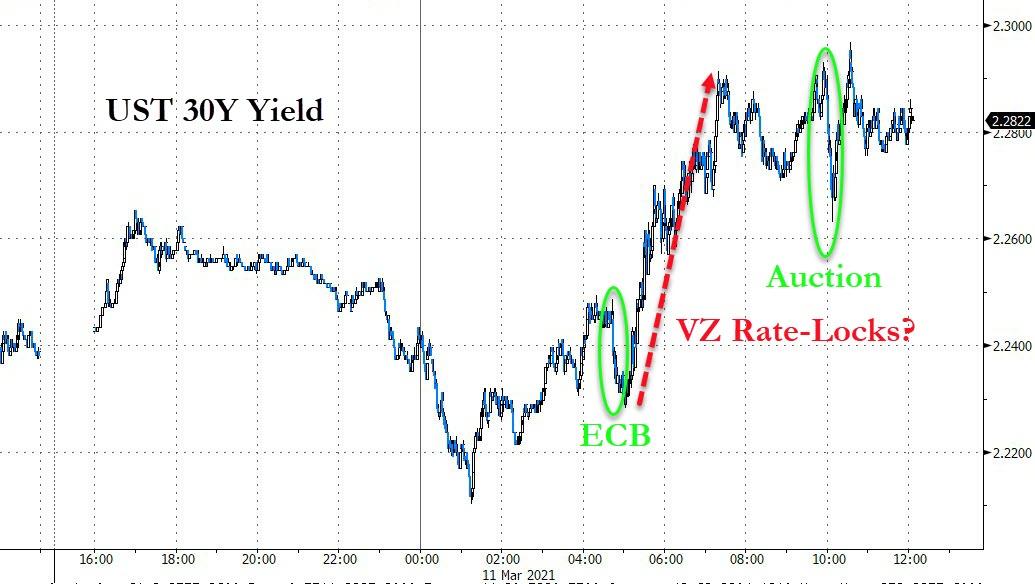
Despite the passing of the $1.9 trillion stimulus package, the US Dollar continued its southerly path, while the 30-year bond yield whip-sawed through the auction and ended higher.
For the week, yields are still lower, but that could change tomorrow when the highly anticipated PPI (Producer Price Index) will be released.
2. ETFs in the Spotlight
In case you missed the announcement and description of this section, you can read it here again.
It features some of the 10 broadly diversified domestic and sector ETFs from my HighVolume list as posted every Saturday. Furthermore, they are screened for the lowest MaxDD% number meaning they have been showing better resistance to temporary sell offs than all others over the past year.
The below table simply demonstrates the magnitude with which these ETFs are fluctuating above or below their respective individual trend lines (%+/-M/A). A break below, represented by a negative number, shows weakness, while a break above, represented by a positive percentage, shows strength.
For hundreds of ETF choices, be sure to reference Thursday’s StatSheet.
For this current domestic “Buy” cycle, here’s how some our candidates have fared:
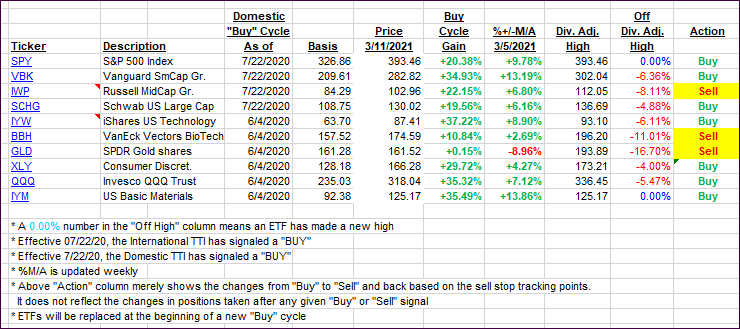
Click image to enlarge.
Again, the %+/-M/A column above shows the position of the various ETFs in relation to their respective long-term trend lines, while the trailing sell stops are being tracked in the “Off High” column. The “Action” column will signal a “Sell” once the -8% point has been taken out in the “Off High” column. For more volatile sector ETFs, the trigger point is -10%.
3. Trend Tracking Indexes (TTIs)
Our TTIs edged higher as the rally was broad.
This is how we closed 3/11/2021:
Domestic TTI: +20.41% above its M/A (prior close +19.60%)—Buy signal effective 07/22/2020.
International TTI: +19.14% above its M/A (prior close +18.38%)—Buy signals effective 07/22/2020.
Disclosure: I am obliged to inform you that I, as well as my advisory clients, own some of the ETFs listed in the above table. Furthermore, they do not represent a specific investment recommendation for you, they merely show which ETFs from the universe I track are falling within the specified guidelines.
Contact Ulli