
- Moving the markets
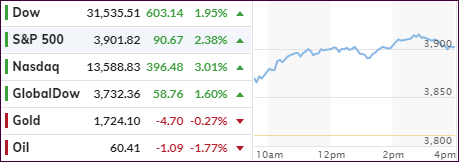
For a change, the positive mood in overnight futures trading, carried through into the regular session with equities surging out of the gate without so much as taking a pause.
Turns out that after last week’s rut, some Central Banks (CBs) around the world were not taking any chances. Some doubled the amount of daily QE (Quantitative Easing) thereby causing bond yields to plunge, which gave equities a much-needed boost.
Other CBs joined the party not with definitive action but via using the effective tool of jawboning. The ECB, for example, said that it will not tolerate higher yields and expects Fed head Powell to calm markets as soon as this week.
And there you have it. Any possibility of a free market setting rates and trading based on price discovery has forever been banned, and we continue to live in a managed market environment, an opinion I have presented ad nauseam.
All last week’s concerns are now forgotten, and the major indexes jumped into March and closing solidly in the green. Hope of economic reopening along with vaccine optimism helped the tech sector to sport gains of some 3%.
With bond yields heading lower, last week’s inflation concerns have now been moved to the back burner, but should not be forgotten, as US PMIs (Purchasing Managers Index) signaled that “record-breaking inflation is on the way,” as ZH described it.
The red line in the sand, above which bond yields will become an issue for stock prices, is the 1.45% level, as Bloomberg points out in this chart. Today, we lucked out in that this level was not breached to the upside.
Right now, the bulls seem to be in charge, and we will make our adjustments accordingly.
2. ETFs in the Spotlight
In case you missed the announcement and description of this section, you can read it here again.
It features some of the 10 broadly diversified domestic and sector ETFs from my HighVolume list as posted every Saturday. Furthermore, they are screened for the lowest MaxDD% number meaning they have been showing better resistance to temporary sell offs than all others over the past year.
The below table simply demonstrates the magnitude with which these ETFs are fluctuating above or below their respective individual trend lines (%+/-M/A). A break below, represented by a negative number, shows weakness, while a break above, represented by a positive percentage, shows strength.
For hundreds of ETF choices, be sure to reference Thursday’s StatSheet.
For this current domestic “Buy” cycle, here’s how some our candidates have fared:
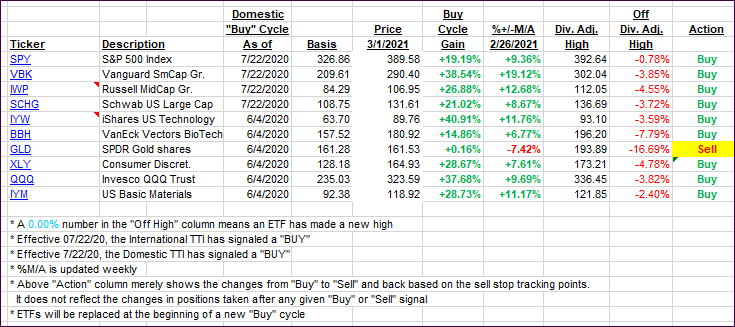
Click image to enlarge.
Again, the %+/-M/A column above shows the position of the various ETFs in relation to their respective long-term trend lines, while the trailing sell stops are being tracked in the “Off High” column. The “Action” column will signal a “Sell” once the -8% point has been taken out in the “Off High” column. For more volatile sector ETFs, the trigger point is -10%.
3. Trend Tracking Indexes (TTIs)
Our TTIs took reversed course and jumped with the major indexes.
This is how we closed 3/1/2021:
Domestic TTI: +18.32% above its M/A (prior close +15.70%)—Buy signal effective 07/22/2020.
International TTI: +16.84% above its M/A (prior close +14.82%)—Buy signal effective 07/22/2020.
Disclosure: I am obliged to inform you that I, as well as my advisory clients, own some of the ETFs listed in the above table. Furthermore, they do not represent a specific investment recommendation for you, they merely show which ETFs from the universe I track are falling within the specified guidelines.
Contact Ulli